


Productivity and the Machinery and Equipment Capital Stock
Business investment and Australian industry productivity

There are many issues that affect productivity. Some are long-term, such as innovation, R&D, and education and training systems. Others are structural, like the number of micro and small firms, or institutional, like state based occupational licensing and building codes. However, for Australian industry by far the most important factor in its low level of productivity growth is the lack of business investment in the capital stock (which is the accumulated amount of machinery, equipment, buildings, structures, software and R&D).
Economic growth comes from increasing productivity, which is determined by the amount and quality of capital per worker and the rate of adoption of new technology. With investment the capital stock is upgraded and grows [1], so a low level of investment means slower growth in output, increasing economic inefficiency, less economic dynamism, and lower productivity. Industry investment in physical and intellectual assets is central to building capacity and upgrading technology.
The most widely used labour productivity measure is gross domestic product per hour worked. Labour productivity is also available as gross value added per hour worked for 16 industries in the market sector, which excludes three industries that lack meaningful prices and volume measures of output: Public Administration and Safety; Education and Training; and Health Care and Social Assistance. It can also be estimated as industry value added (IVA) per person employed.
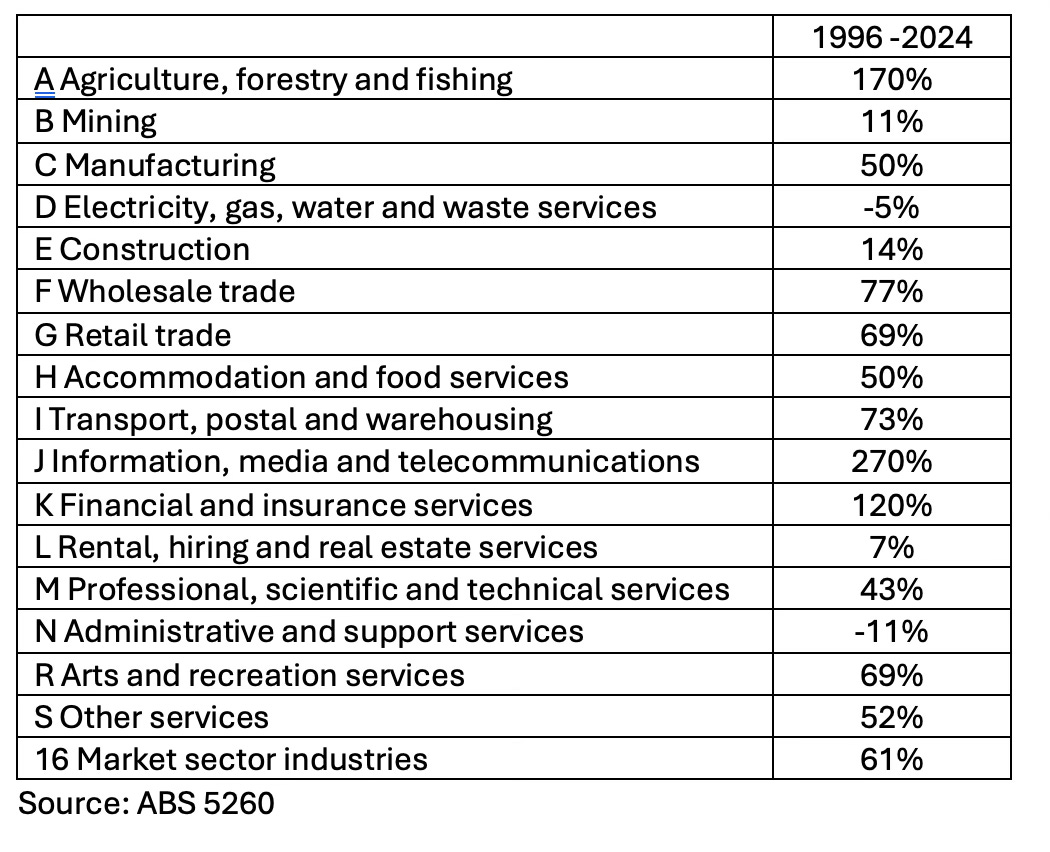
In Australia there is a wide difference between a few high productivity growth market sector industries and two groups of low to medium and very low or negative productivity growth industries. On the hours worked measure for labour productivity, since 1995-96 there were three very high growth industries (over 100%), seven with medium growth (50-99%), and four industries with very low growth (under 50%), and two with negative growth.
Table 1. Labour productivity hours worked basis, percent change
How does the M&E capital stock and capex data line up with the productivity stats from the ABS? This post looks at the 2023-24 data from the Australian Bureau of Statistics for productivity, capital stock, and gross fixed capital formation (GFCF, i.e. capital expenditure or capex) on machinery and equipment (M&E). Total GFCF was $649 billion, with $245 billion in Non-dwelling construction the largest component, followed by $142 billion on Dwellings. Expenditure on M&E was $129 billion, much more than the $41 billion spent on Software and $27 billion on R&D, the two other main components of investment by Australian industry.
Capital and Productivity
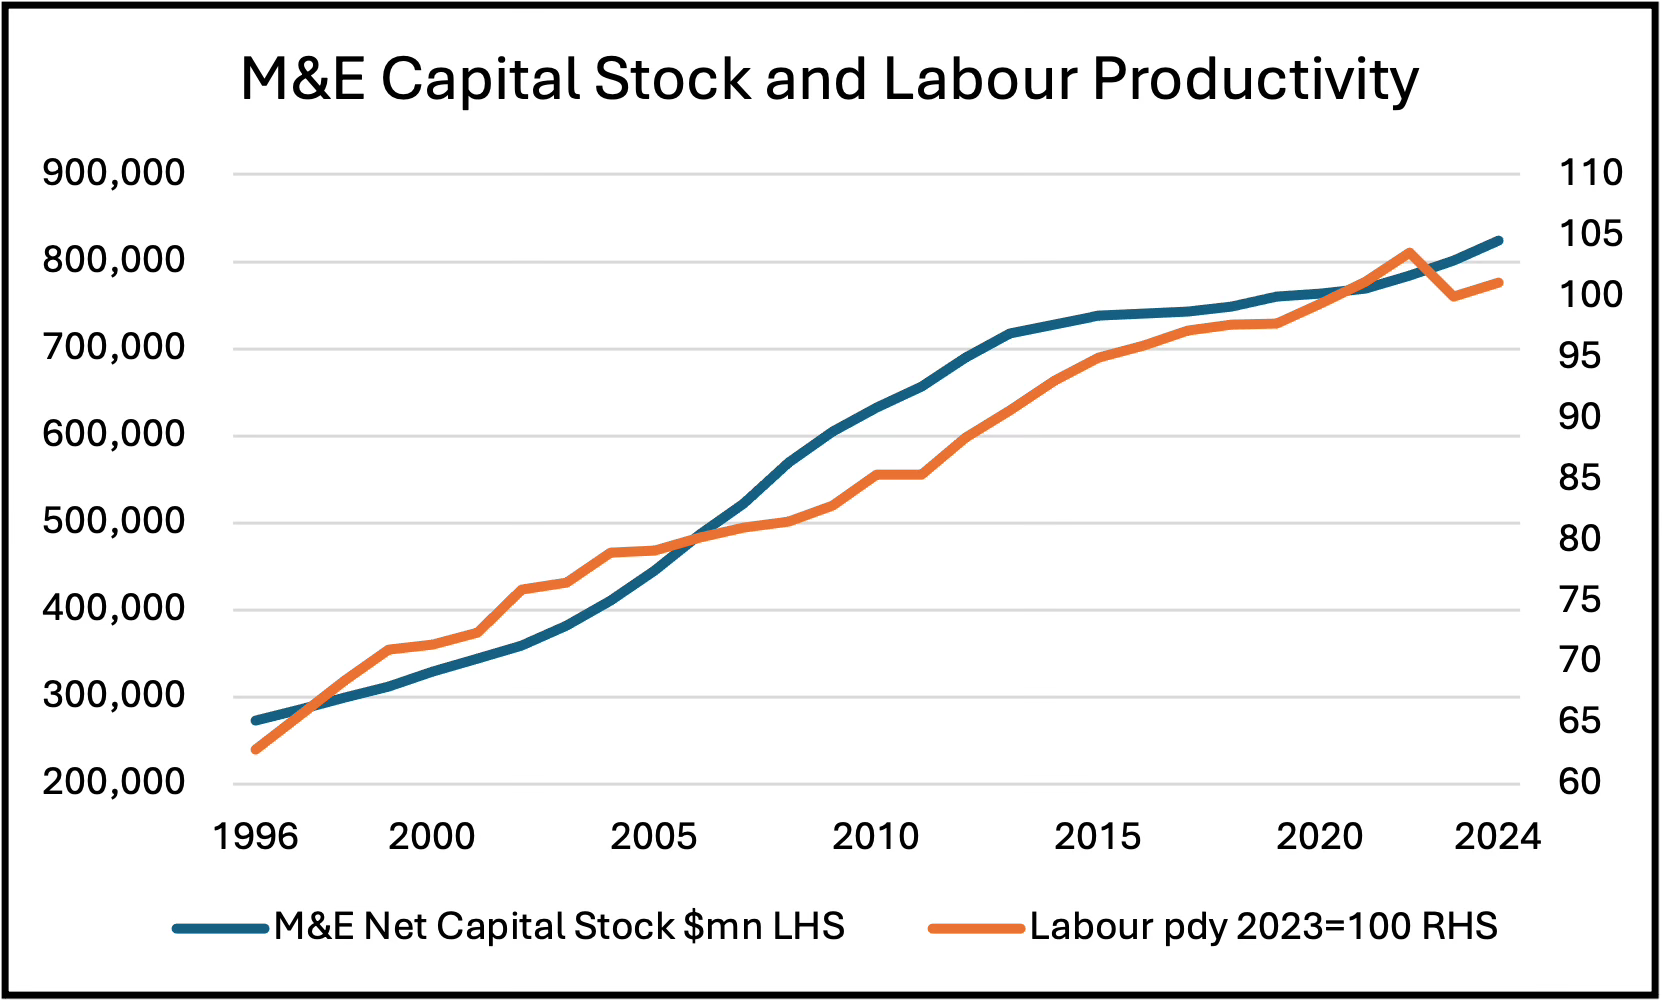
Figure 1 shows the M&E net capital stock chain volume measure for All Industries, i.e. capital stock adjusted for depreciation due to use and for changes in prices for the 16 market sector industries, and the hours worked labour productivity measure. There is clearly a relationship between them, but there is a lag of a couple of years between changes in M&E capital stock and productivity. After 2005 the capital stock began rising but productivity followed three years later, and followed two years after the increase in capital stock flattened out from 2015. After the COVID spike in 2021 productivity has returned to trend.
Figure 1. Machinery and equipment capital stock and productivity

Source: ABS 5204
Note: All Industries net capital stock chain volume measure, and hours worked labour productivity.
Machinery and Equipment Capital Stock
Since the financial crisis in 2008 machinery and equipment capital expenditure (M&E capex) has been falling, from eight to around four percent of GDP. With less investment the capital stock grows more slowly, leading to less or older capital per worker, slower growth in output, and therefore lower productivity. With a low rate of growth firms will not invest, or invest less, in expanding capacity and innovation. The result is less economic dynamism and increasing economic inefficiency, leading to lower growth in productivity and GDP. Very broadly, the net capital stock of M&E in each industry is around eight times their annual capex.
The top five industries in Figure 2 account for 53% of total M&E net capital stock, showing how concentrated the M&E capital stock is in Australia. The industries are Mining, Transport, postal and warehousing, Manufacturing, Agriculture and Construction.
Figure 2. Machinery and equipment capital stock by industry
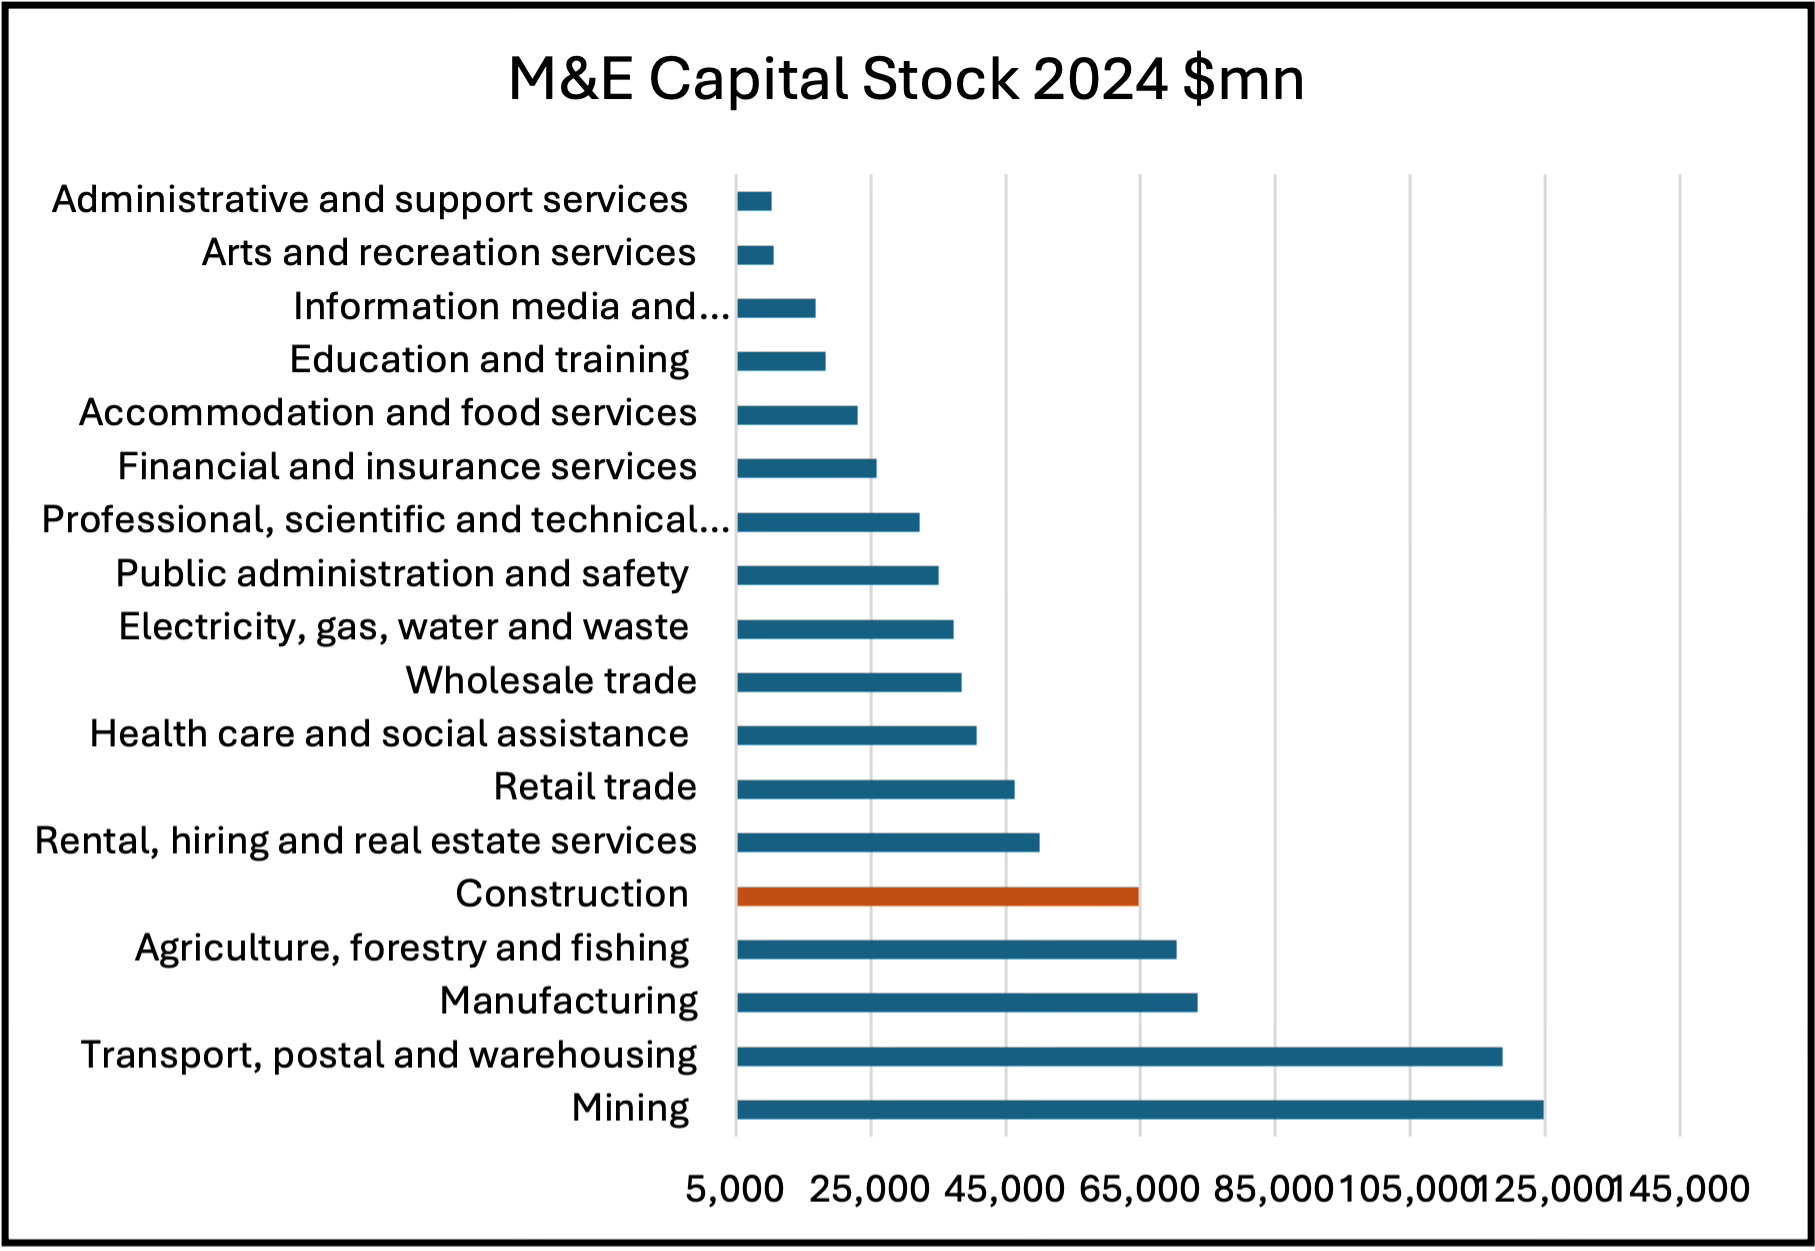
Source: ABS 5204
Machinery and Equipment Capital Expenditure
M&E capex is also concentrated in five industries that accounted for 52% of the total in 2024. The two industries of Mining and Transport spent over $17 billion each, Manufacturing $12 billion, Construction $11.6 billion, and Agriculture $9 billion. The next five industries include four that spent between $6 and $7 billion, and one that spent $5.2 billion.
Figure 3. Machinery and equipment capital expenditure by industry
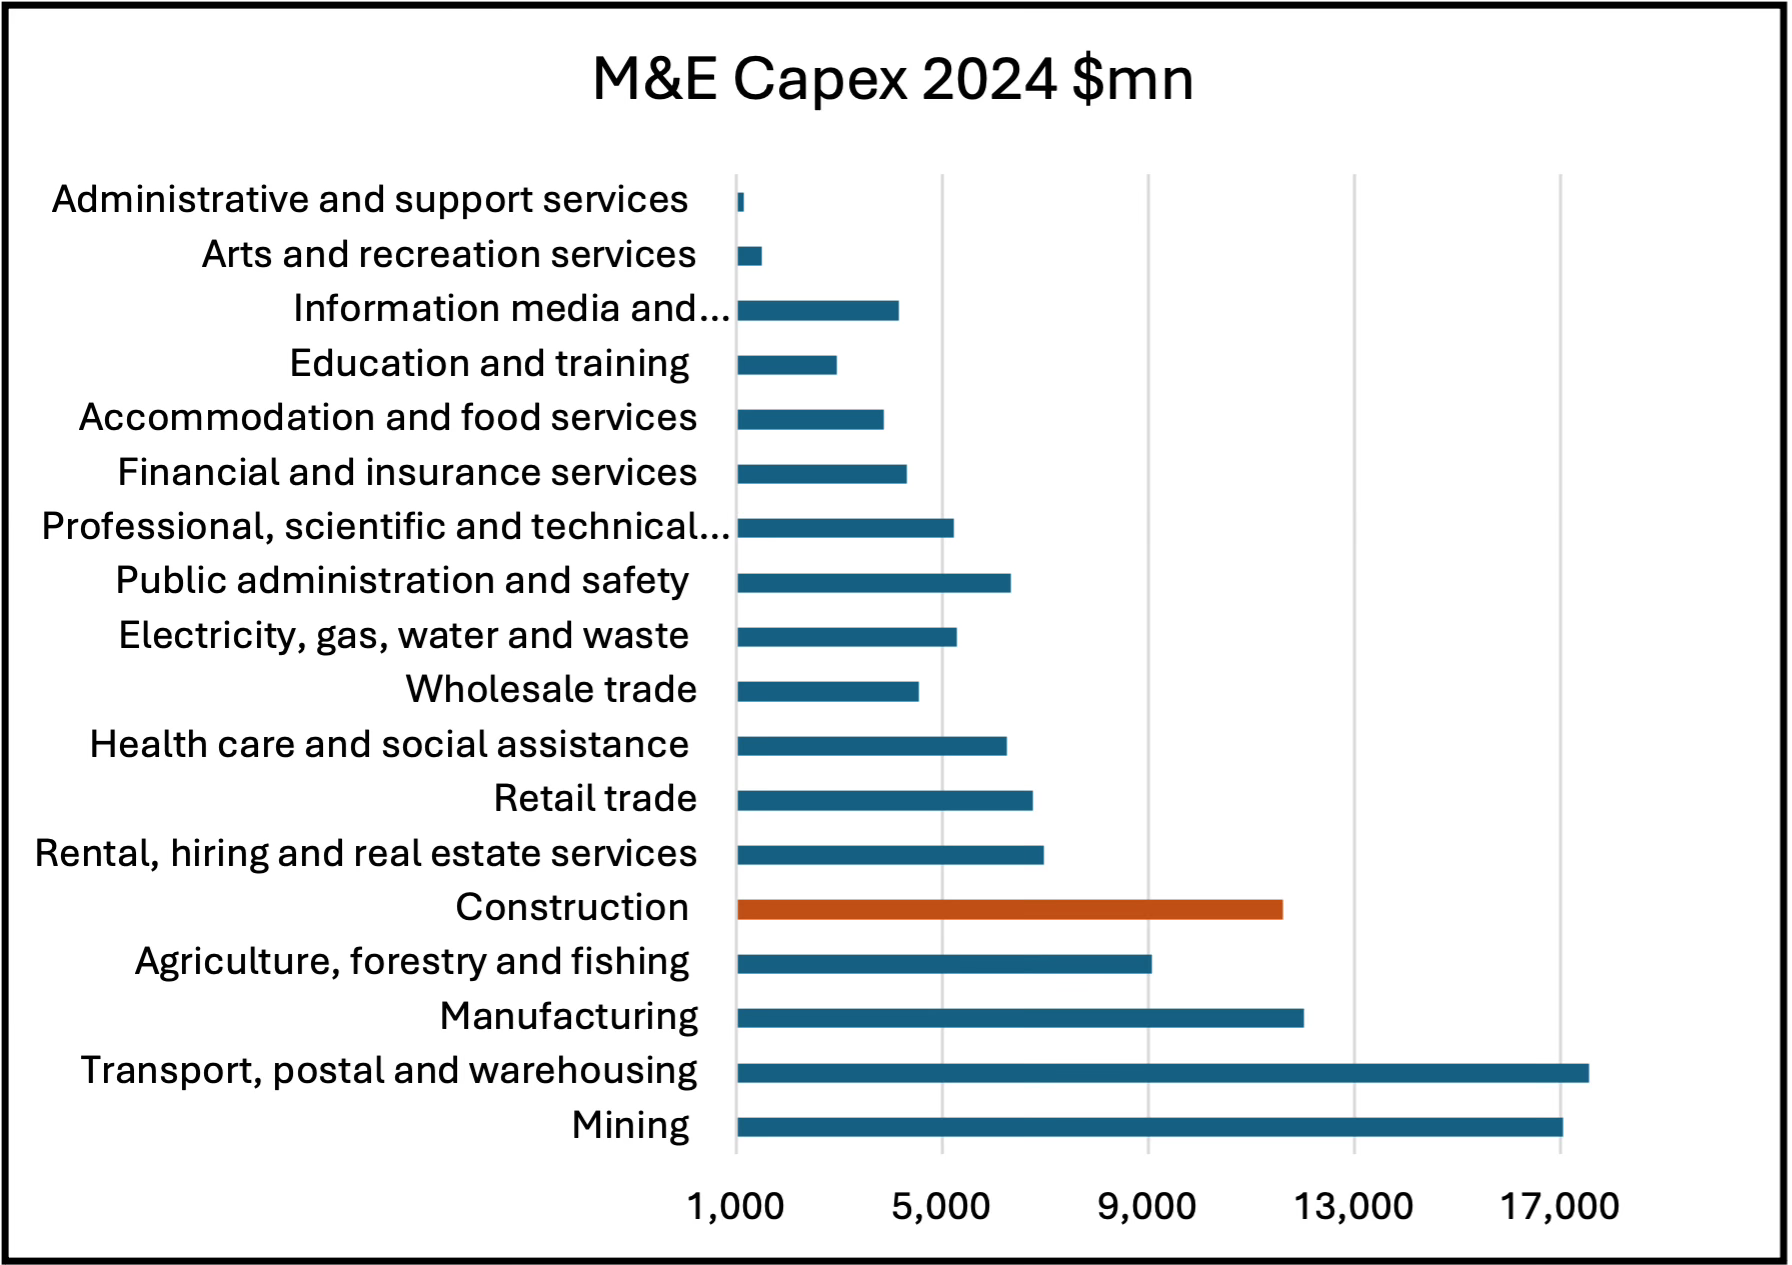
Source: ABS 5204. Ranked by M&E capital stock.
Productivity Growth
Over the last five years there have been significant differences between industries in productivity growth. Table 2 has the 16 industries in the market sector, and shows between 2019 and 2024 three industries had high growth in output per hour worked of over 10%, but overall performance has been affected by five industries with negative growth, low growth in another seven industries, and no growth in construction. For most industries, MFP growth was worse than for labour productivity as hours worked. The highest performing industries were Agriculture, Forestry and Fishing and Information, Media and Telecommunications, the worst performing industries were Mining and Electricity, Gas, Water and Waste.
Table 2. Market sector productivity growth
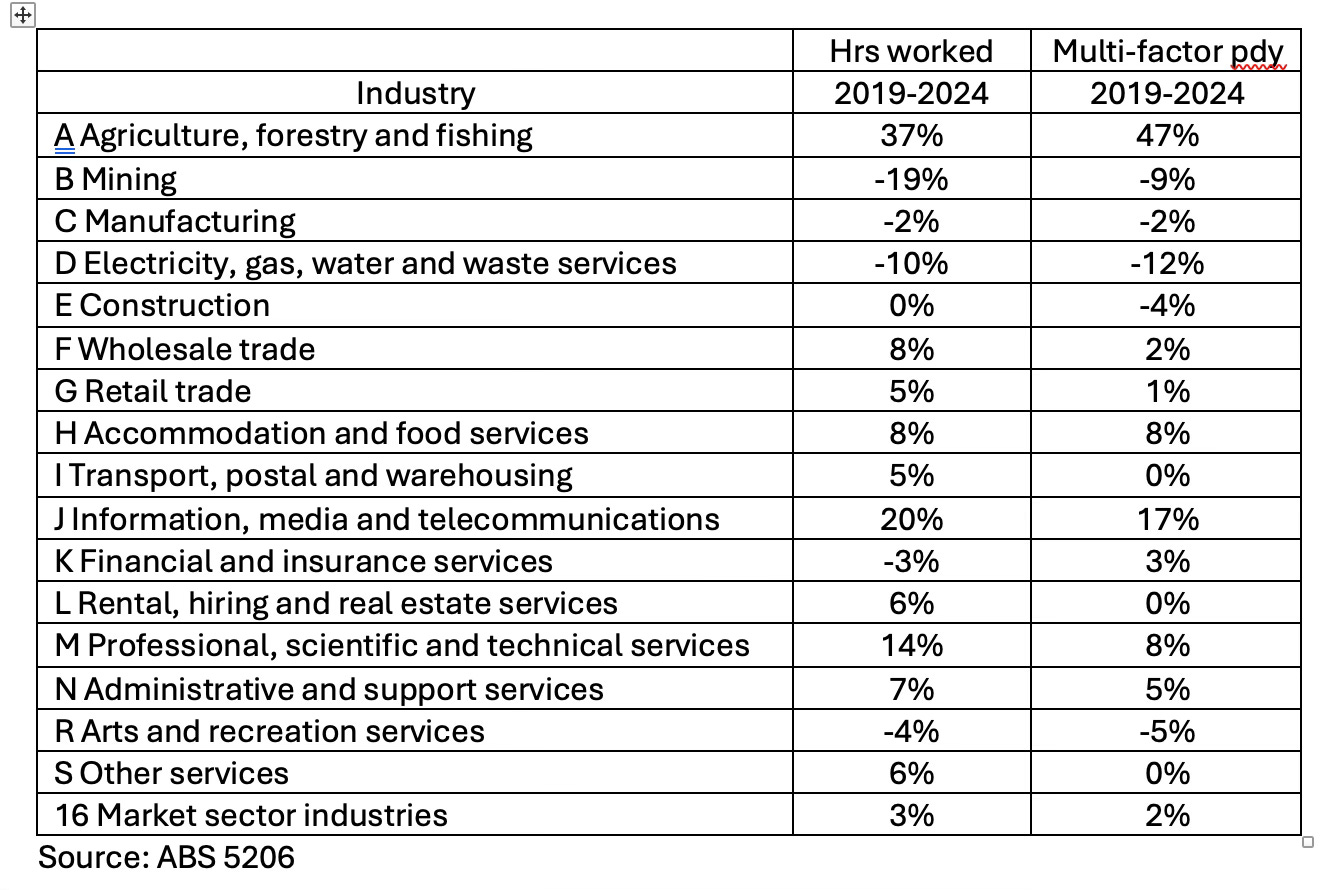
The problem is that Mining, Manufacturing, Construction and Transport are industries that have the largest M&E capital stock and capex, but low or no productivity growth. This implies there are inefficiencies in those industries that have constrained productivity growth, which may be due to industrial relations and conditions but also could reflect poor management, supply chain and logistics issues, or a low rate of adoption of new technology. Agriculture is the exception, with both a large capital stock and high productivity growth.
Another issue is that Capital productivity has been falling since 1995-96. The decline in capital productivity is one reason Australia’s productivity growth has been so low, because over the last decade the low level of business investment means the capital stock has not been getting replaced and updated.
Figure 4. Capital productivity and private gross fixed capital formation
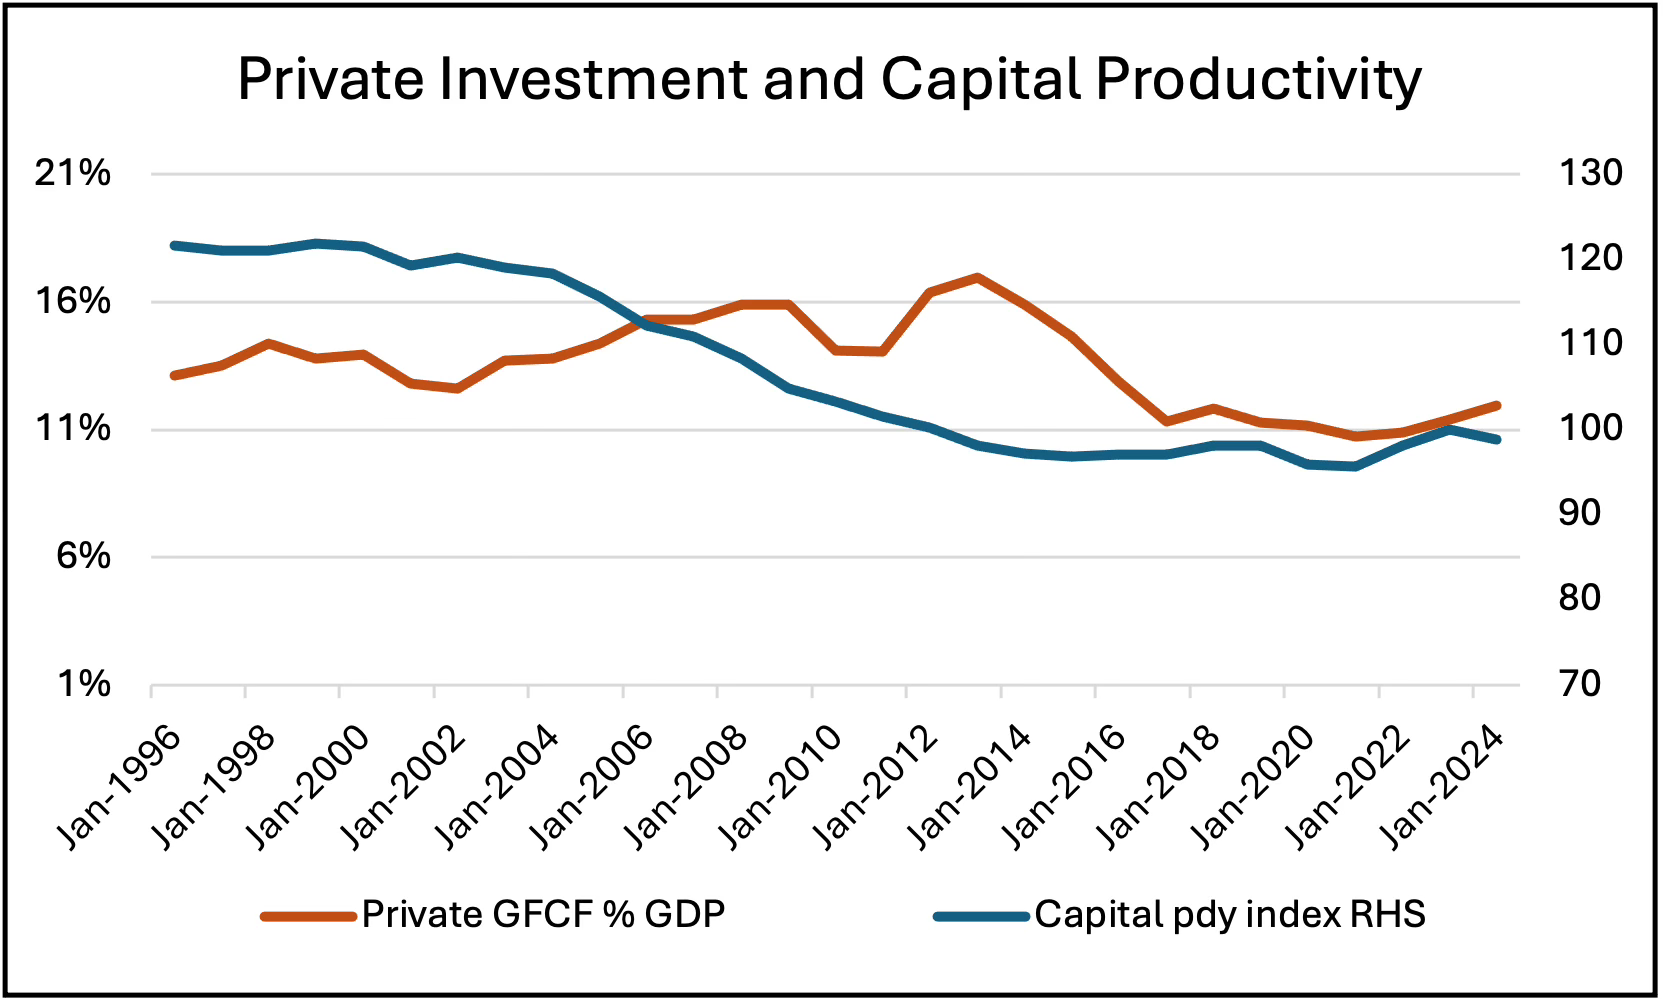
Source: ABS 5206. Total private GFCF as percent of GDP in current dollars.
Figure 4 shows Total private gross fixed capital formation (GFCF), which is private sector investment in the capital stock, and capital productivity. The increases in GFCF during the fiscal response to the 2008-09 global financial crisis and the expenditure on plant and equipment during the mining boom from 2012 are apparent. What is significant is that capital productivity and the share of GDP of private GFCF were flat after 2016, before an increase in GFCF in 2023 and 2024 lifted capital productivity.
M&E Per Worker
Another factor is capital intensity and increasing or decreasing capital per worker. Increased capital per worker is capital deepening, which means that labour has more capital to work with to produce output. Changes in the amount of M&E per worker vary greatly across industries. Figure 5 shows the change in the volume of M&E capital stock per person employed between 2010 and 2024 and two measures of labour productivity.
Figure 5. Change productivity and M&E capital stock per person employed
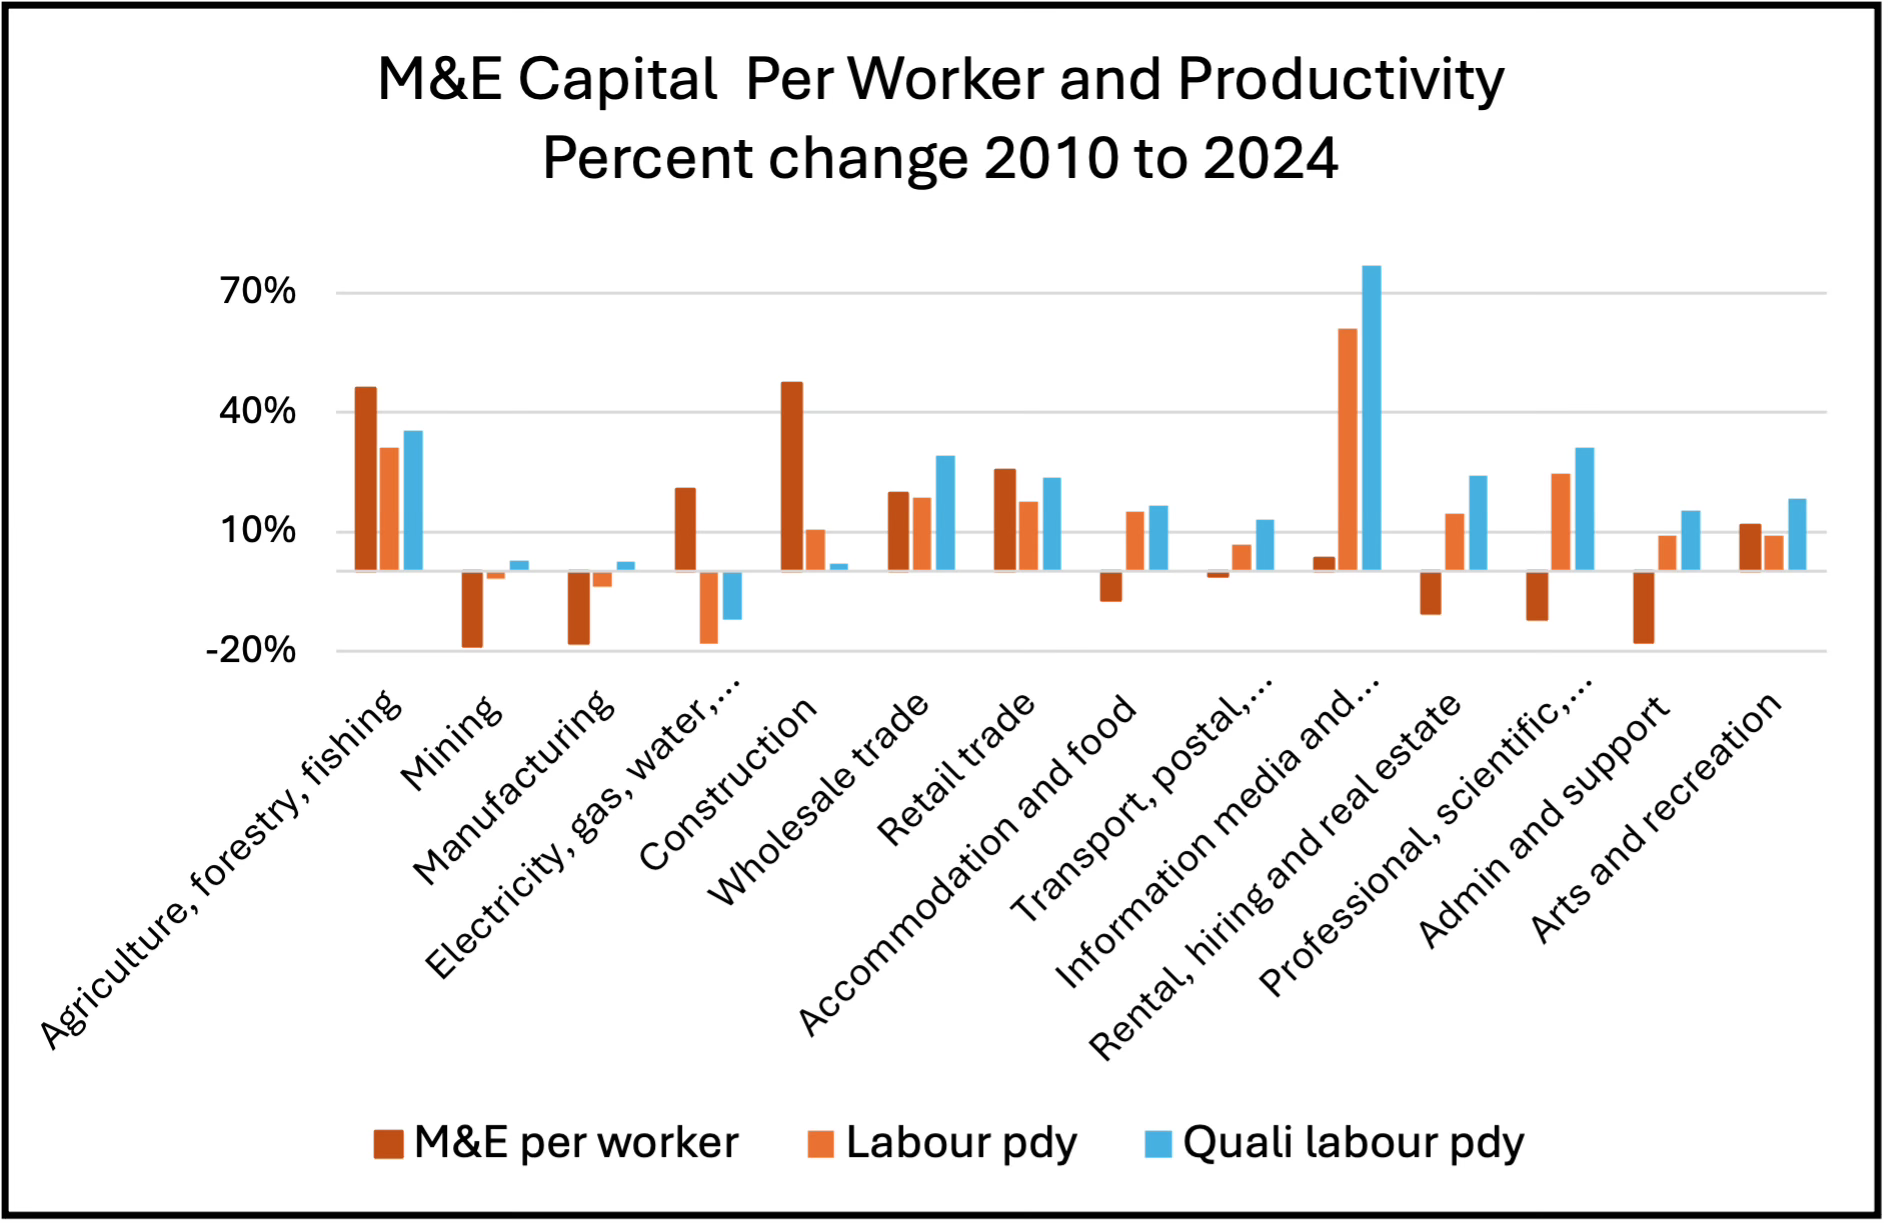
Source: ABS 5204
Note: Annual chain volume measure of net capital stock divided by the number of workers in June, hours worked Labour productivity, and Quality adjusted hours worked labour productivity.
Figure 1 showed the relationship between M&E net capital stock and the hours worked labour productivity measure. Figure 5 disaggregates both the M&E capital stock and productivity to show the wide range of difference between industries. The overall measures balance out industries with decreased M&E capital per worker (known as capital shallowing), which includes Mining, Manufacturing and Professional, scientific and technical services, with those that have increased capital per worker (capital deepening) such as Agriculture, Electricity, gas, water and waste, Construction, Wholesale trade and Retail trade.
Similarly, industries with increased labour productivity like Agriculture, forestry and fishing, Wholesale trade, Retail trade, and Information, media and telecommunications, balance out those with decreased labour productivity like Mining, Manufacturing, Electricity, gas, water and waste, and Construction, which is an outlier because Construction had a large increase in M&E capital per worker but little increase in productivity.
There is no clear pattern here. Agriculture, forestry and fishing, Wholesale trade, and Retail trade had increased productivity and capital deepening. However, Rental, hiring and real estate services, Professional, scientific and technical services, and Administrative and support services had capital shallowing but increased productivity. (This might be associated with the difficulty of measuring output accurately in service industries). Also, other forms of capital besides M&E are important in some industries, for example Professional, scientific and technical services and Information, media and telecommunication have high levels of capex on software, and the former also has the largest expenditure on R&D capex.
Conclusion
In the short run the single most important factor in increasing the rate of Australia’s productivity growth would be to increase business investment. Because business investment in Australia is so concentrated, industry policies to improve productivity should be targeted at those industries with the largest capital stock and capex but low productivity growth.
The top five industries account for 53% of total machinery and equipment net capital stock, showing how concentrated the M&E capital stock is. Those industries are Mining, Transport, postal and warehousing, Manufacturing, Agriculture and Construction. M&E capex is also concentrated in those five industries, which accounted for 52% of the total in 2024.
The problem is that although Mining, Manufacturing, Construction and Transport are the industries that have the largest M&E capital stock and capex, they have had low or no productivity growth. That may be due to industrial relations and conditions, but also could reflect poor management, supply chain and logistics issues, or a low rate of adoption of new technology. Agriculture is the exception, with both a large capital stock and high productivity growth.
Another factor is capital intensity and increasing or decreasing capital per worker. Changes in the amount of M&E per worker varied greatly across industries between 2010 and 2024, and when comparing those changes to labour productivity there is no clear pattern. A few industries had increased productivity and capital deepening. However, others had capital shallowing but increased productivity. Construction had more M&E capital per worker but little increase in productivity.
Australian productivity will be improved by increased investment in the capital stock. That may not be the only factor, but in the short run it is the most important one. Traditional policy instruments to increase investment in M&E are tax incentives like accelerated depreciation, and financial incentives like production subsidies, grants and loan guarantees. These are blunt instruments, but they can be targeted at high growth frontier firms with high productivity and the high growth industries that drive economic expansion, which could become part of the Future Made in Australia policy.
Business investment in M&E can also be promoted by identifying and removing barriers to investment like slow approvals for construction of new factories, development of new industry technology strategies, revising public procurement methods, offering prizes for technological innovation, and incentives like advanced market commitments for new products like prefabricated buildings and services like digital twins.
The contemporary approach to industrial policy is more about establishing collaboration between the public and private sectors, and developing an institutional framework within which collaboration can best work. This emphasises supply of economic inputs such as energy, transport and skilled workers, but also requires a focus on outcomes and outputs instead of processes and procedures. If the outcome is more M&E capital for workers, that should also lead to more output and higher productivity.
[1] Capital stock in the current year is last year’s stock minus depreciation (from use) plus new investment.
Mining is doomed to show low productivity growth as you successively exhaust the better mines.
Against Prefabricated Follies: A Case for Structural Reform
I remain deeply skeptical of government procurement schemes or advanced market commitments for prefabricated housing technologies. The notion of prefabricated construction has persisted for over a century, with various enterprises—including Toyota—attempting to render it economically viable. What novel technology or management innovation has emerged to suddenly make prefabricated homes economical when decades of previous efforts have foundered?
If we genuinely seek capital deepening in the construction sector, the solution lies not in speculative industrial policy but in deregulating residential housing, particularly height restrictions. Apartment construction possesses higher capital intensity than individual dwellings—or rather, represents structural transformation toward greater productivity. This constitutes the most obvious path to increased efficiency, as opposed to chasing the chimera of prefabricated housing subsidies.
Regarding service sector productivity, I propose a dual explanation for the paradox of rising productivity amid falling capital intensity. First, the dramatic decline in ICT equipment and software costs means Australian businesses utilize more information technology while paying lower prices, creating the appearance of reduced capital intensity. Second, increased human capital among service workers generates productivity gains without corresponding capital investment, while software serves primarily as a management tool enabling superior workforce allocation.
Given that transport ranks among our top three sectors, certain emerging technologies merit attention. Electric vehicles and autonomous driving represent proven technologies with demonstrable gains. The government should therefore invest in charging infrastructure while maintaining a permissive regulatory environment for self-driving vehicles, welcoming both Chinese and American participants into the Australian market.