
Physical and Intellectual Capital in Australian Industry
Capital investment drives productivity

It is widely recognised that productivity is a multi-dimensional issue, with many different elements playing a role. Although productivity is largely determined by the amount and quality of capital per worker, their skills and experience, and the rate of adoption of new technology, this post shows that an important determinant of productivity is capital investment in both physical and intellectual capital.
Both capital expenditure (capex) and capital stock is highly concentrated in Australia. The machinery and equipment (M&E) capital stock is concentrated in five industries, and digitisation of Australian industry is narrow and shallow. because two industries have almost half total software net capital stock, and have a large share software capex. Similarly, a two industries have over half of the research and development (R&D) capital stock.
The data this post uses is from the Australian Bureau of Statistics 2024-25 National Accounts tables 63 and 64 for net capital stock and gross fixed capital formation (GFCF, i.e. capex). Net capital stock is the cumulative value of GFCF depreciated by the ABS using the perpetual inventory method, where investment is added to capital stocks and retired assets are deducted based on the average length of time they are used in production.
This post first looks at the relationship between physical and intellectual capital and productivity, using the total net capital stock for M&E, software, R&D and labour productivity. Then the capital expenditure and capital stock for M&E, software, and R&D for 19 industries is compared. The conclusion summarises the main points and argues that to improve Australia’s productivity requires a significant increase in capital investment, both physical and intellectual.
Capital Stock and Productivity
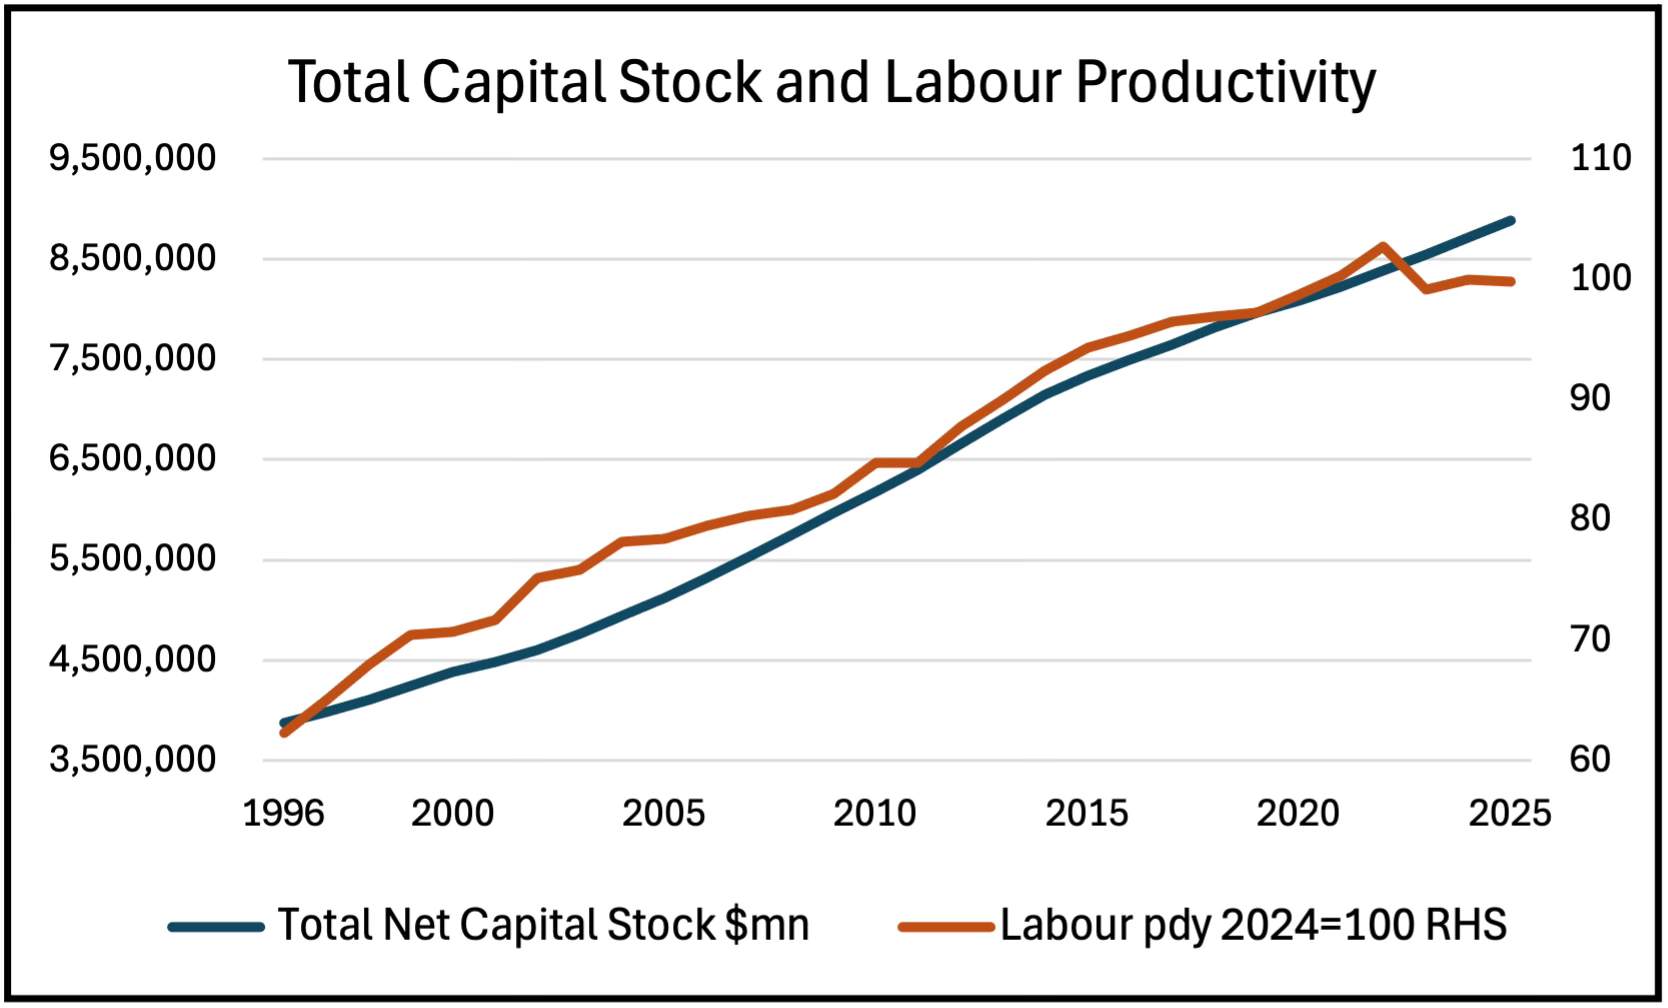
As Figure 1 shows, there is a clear historical relationship between the total net capital stock and labour productivity. The total net capital stock has grown steadily over the last 30 years, and was matched by the rate of increase in labour productivity until 2020. Despite the capital stock growing, the relationship has broken down over the last few years as labour productivity flatlined.
There has been no growth in productivity over the last few years. Although investigating the causes of this lack of productivity growth and resolving the issues should be a high priority for Australian business, there are few indications that this is the case and industry appears to assume this is a problem for the government to solve through regulatory reform and fewer restrictions. Although reviews and reform of regulations is worthwhile and government can be a facilitator of improved productivity, it is not a substitute for industry, which has to take responsibility for matching capital investment with the training and improved processes needed to increase the growth rate of productivity.
Figure 1. Total capital stock and labour productivity

Source: ABS 5204 and 5260. 16 market sector Industries net capital stock chain volume measure, and hours worked labour productivity.
As well as M&E, Software and R&D, the total capital stock includes Non-dwelling construction, Weapons systems (in Government), Cultivated biological resources (in Agriculture), Mineral and petroleum exploration (in Mining), and Artistic originals.
Machinery and Equipment
Figure 2 shows the that the M&E capital stock and labour productivity have been closely linked, although there is a lag between changes in the capital stock and changes in labour productivity growth. Between 1996 and 2015, labour productivity rose as the M&E capital stock increased, but it took a couple of years for productivity growth to increase after 2005, when the capital stock began increasing. Then in 2013 the capital stock stopped rising, and a couple of years later productivity growth flattened out. Since 2023 the M&E capital stock has grown strongly but productivity has not.
Figure 2. Machinery and equipment capital stock and productivity
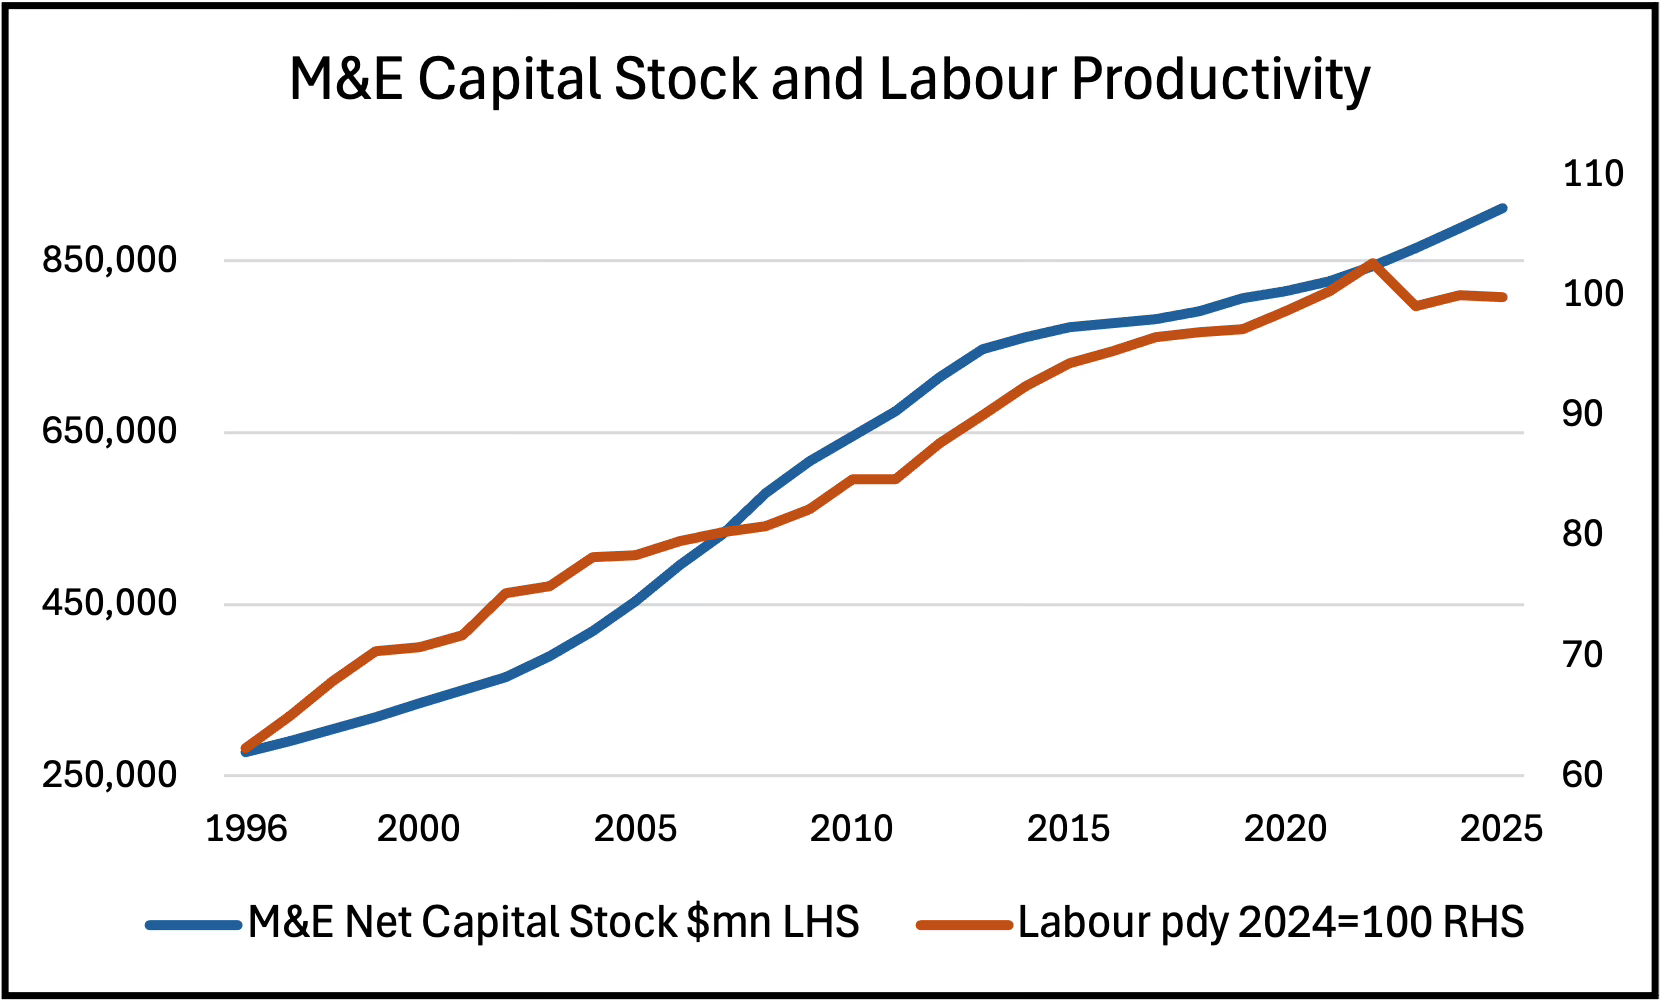
Source: ABS 5204 and 5260. 19 Industries net capital stock chain volume measure, and hours worked labour productivity.
There are several reasons why the M&E capital stock affects productivity: new M&E typically replaces older but similar M&E, so does not require a lot of training or reorganisation, and is unlikely to be underutilised; new M&E will usually be smarter and more automated, so it will increase output but require less labour; small firms have access to the same new M&E as large firms; and diagnostic software in new M&E makes maintenance easier with less downtime.
Software
In the 2000s the software net capital stock increased slowly, but in the 2010s the rate of increase began to grow, and over the last 10 years the software capital stock has grown rapidly, and much more than labour productivity. There is no suggestion of causality in Figure 3. In particular, the post-2021 sharp increase in software capital stock is not reflected in the productivity index.
Figure 3. Software capital stock and productivity
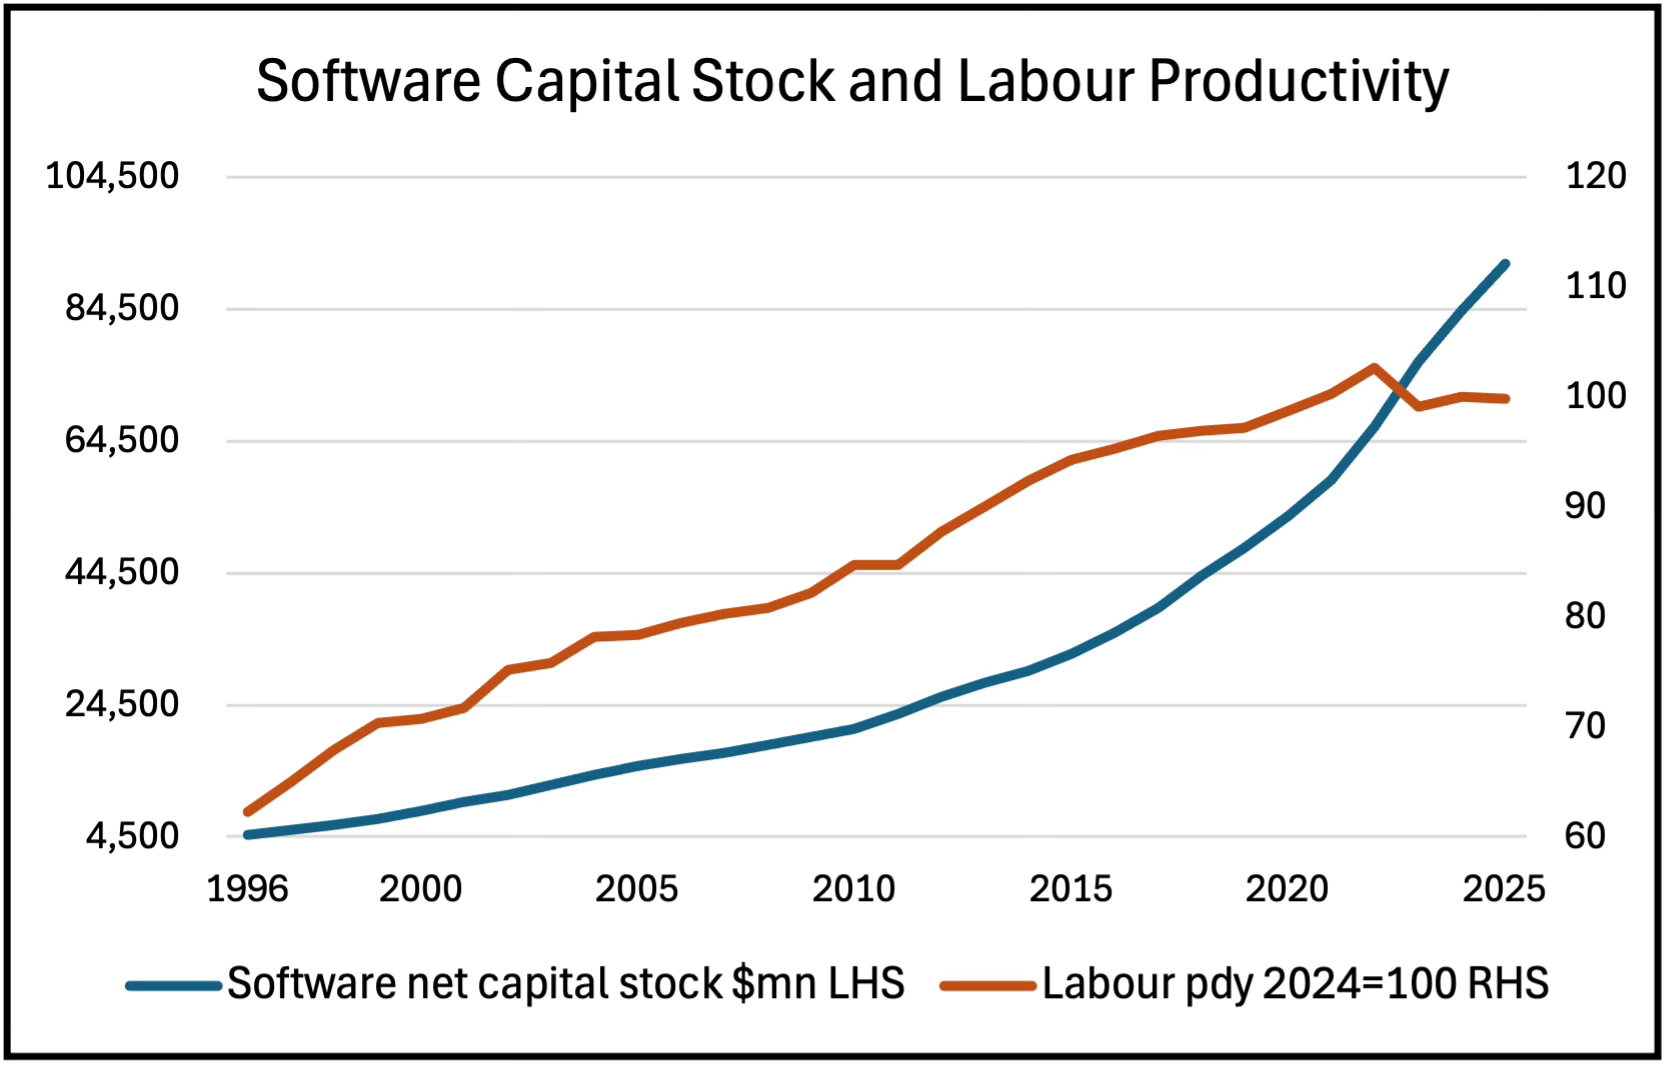
Source: ABS 5204 and 5260. 19 Industries net capital stock chain volume measure, and hours worked labour productivity.
The differences between software and M&E are important, and explain why there is a weaker relationship between the software capital stock and productivity. First is the training and learning required with new software, particularly for large complex systems, and the time it takes to become familiar with a new system or major update. Second, underutilisation is an issue because there are often features in a software system that are not used, but have to be paid for. Third is the implementation challenge, because software and IT investments will often be disruptive and many have been expensive failures. Finally, to take full advantage of new systems will typically require reorganisation, with redesigned processes and restructured roles. Small firms find all these factors more challenging than large firms with more resources and deeper skill sets, and the weak relationship between software capex and productivity growth may be because of the large number of small firms. As an aside, these were the explanations given for the productivity slowdown around 2000, and now they will apply again in the adoption of AI by businesses.
Because the ABS data on M&E capital stock and GFCF includes investment in computers and information technology equipment with all other M&E, the software data is the best indicator of the extent digitisation of Australian industry.
Research and Development
There is only a loose relationship between the R&D capital stock and labour productivity, at times growing less and sometimes faster. The period of strong labour productivity growth between 2010 and 2020 lagged the R&D capital stock. Interestingly, the overall trend in the R&D capital stock follows a similar path to the M&E capital stock, but shows no relationship to the software capital stock. This may be because included in R&D is applied research done by industry, which in the ABS definition has three characteristics:
Goal-Oriented: It is directed toward a specific application, such as solving a particular industry problem or meeting a client’s specific needs.
Originality: It must be original work, not experimental development or innovation.
New Knowledge: Its primary purpose is to acquire new scientific or technical knowledge, even if that knowledge has a narrow, commercial focus.
Figure 4. Research and development capital stock and productivity
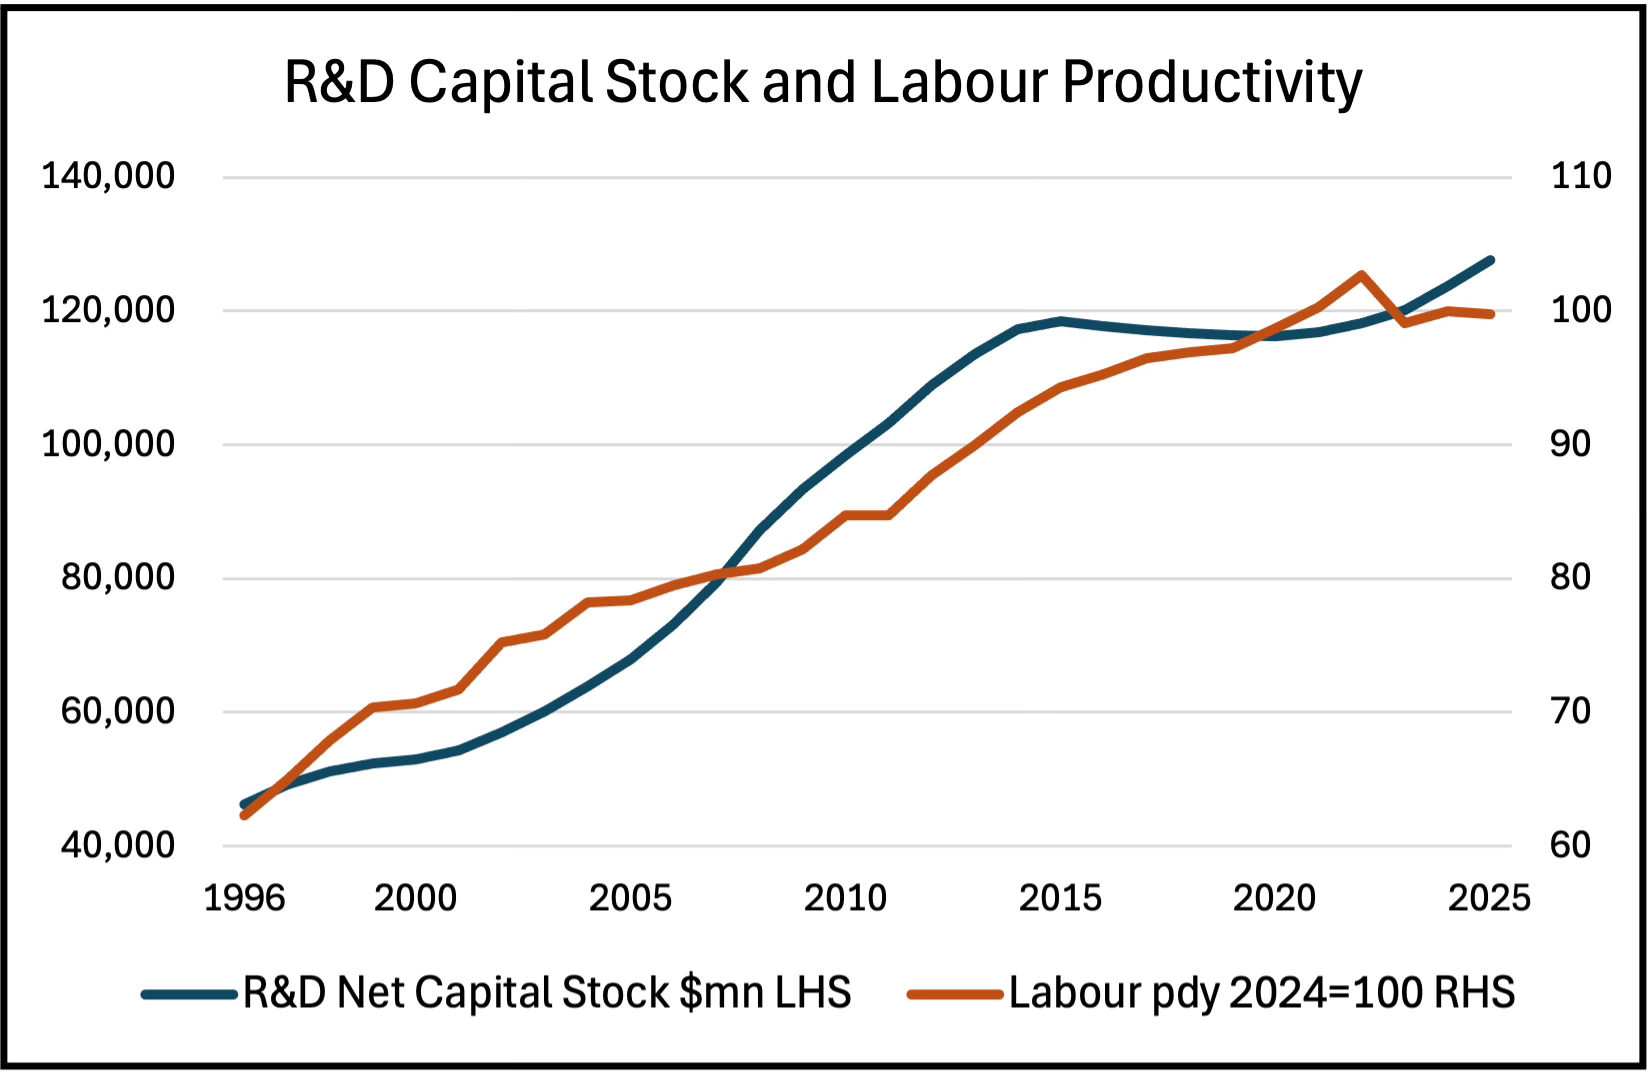
Source: ABS 5204 and 5260. 19 Industries net capital stock chain volume measure, and hours worked labour productivity.
Capital Stock and Capex by Industry
The next figures show Australia’s net capital stock for 19 Industries and their GFCF in 2024-25, in current prices. Net capital stock is the cumulative value of GFCF depreciated by the ABS using a perpetual inventory method. From year to year a couple of industries might move up or down a place in these rankings, but the overall pattern is consistent over time.
Machinery and Equipment Capital Stock and Capex
Figure 5 shows the market sector M&E net capital stock and gross fixed capital formation in 2025. Very broadly, the net capital stock of M&E in each industry is around six to eight times their annual capex. The top two industries are Mining and Transport, postal and warehousing for both capital stock and capex.
Figure 5. Machinery and equipment capital stock and gross fixed capital formation
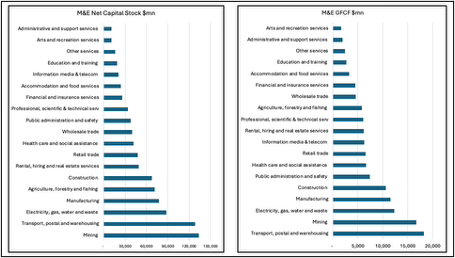
Source: ABS 5204, tables 63 and 64. 2024-25 National Accounts.
Table 1 shows the top five industries accounted for 53% of the total M&E net capital stock. Adding Construction with 7% means six industries out of 19 had 60% of the capital stock. Outside this group of top industries there is a long tail of 11 industries with 5% or less of total M&E net capital stock. M&E capex is also concentrated five industries, with Construction replacing Agriculture in fifth place, and the five industries again accounted for 53% of the total.
Table 1. Industry shares of machinery and equipment capital stock
Source: ABS 5204.
Software Capital Stock and Capex
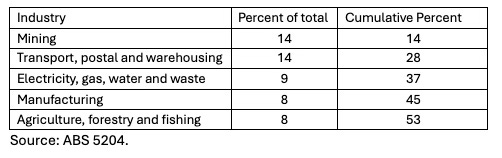
The two industries Professional, scientific and technical services, and Finance and insurance services accounted for 34% of total software net capital stock in 2024-25, showing how extreme the concentration is in Australia. Adding Information, media and telecommunications, and Public administration and safety make up the top four industries with 51% total software capital stock. There were 12 industries with 5% or less of the total software net capital stock.
Figure 6. Software capital stock and gross fixed capital formation
Source: ABS 5204, tables 63 and 64. 2024-25 National Accounts.
The software intensive industries are all services, and it is notable that the goods producing industries of Agriculture, Construction, Manufacturing and Mining are in the bottom half of industries for the value of their software capital stock, which also applies to their software capex.
Table 2. Industry shares of software capital stock
Source: ABS 5204.
Software capex is also concentrated. Professional, scientific and technical services is again the largest with 18%, but Finance and insurance services was second, with those two industries making up 34% of the total, They are followed by Information, media and telecommunications with 9%, Public administration and safety with 7%, and Retail with 6%, so the top five were 56%.
Research and Development Capital Stock and Capex
The ABS has four categories of R&D, based on the type of research: pure basic research; strategic basic research; applied research; and experimental development. It includes work to devise new applications of available knowledge. Over the last few years the area with by far the strongest growth has been Information and computing sciences research, which includes spending on Artificial Intelligence.
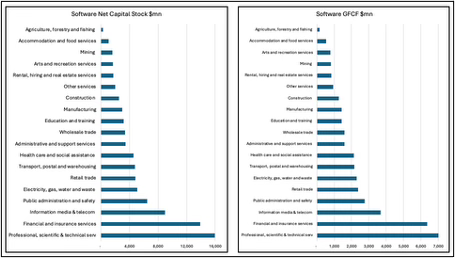
There is only one industry that does a serious amount of R&D in Australia, and that is Professional, scientific and technical services with 34% of the capital stock and 37% of capex in 2024-25. Manufacturing with 18% of the capital stock and 16% of capex, and Finance and insurance services with 11% of the capital stock and 12% of capex make up the top three industries that do R&D.
Figure 7. Research and development capital stock and gross fixed capital formation
Source: ABS 5204, tables 63 and 64. 2024-25 National Accounts.
The top five industries have over three quarters of R&D capital stock in Australia. Four industries have between 5% and 3% of total net R&D capital stock, and there are ten industries that have 2% or less of total R&D.
Table 3. Industry shares of research and development capital stock
Source: ABS 5204.
Investment Tax Breaks
In the short run the single most important factor in increasing the rate of Australia’s productivity growth would be to increase business capital expenditure, on M&E and software especially. In Australia, the most important policy measure is, and has been for a long time, the tax treatment of capex. Assets purchased or built can be depreciated over their working life, reducing tax payable. There are literally thousands of items in the tax office depreciation schedule, all with their own effective lives and depreciation rates.
The capital works schedule of depreciation for buildings and structures allows a deduction of 2.5% per year for 40 years for the construction costs of income-producing buildings, or 4% for eligible new build-to-rent projects since May 2023. Deductions apply to buildings, extensions, and structural improvements like fences or retaining walls, but not the land. Fittings and fixtures have their own depreciation schedules.
The preferred policy of successive Australian governments to increase M&E capex has been accelerated depreciation or instant asset write-offs. As a general rule, these investment tax breaks (ITBs) favour capital intensive industries and companies. Over the last decade, many countries have reduced or ended investment allowances while lowering company tax rates, because there is good evidence that lowering the tax rate increases investment but ITBs are not very effective.
Capped instant asset write-offs for M&E have been a feature of Australian policy since the Global Financial Crisis. They were allowed for small firms with turnover under $2mn in 2012 (cap $6,500), 2015 (cap $20,000) and 2023-25 (turnover under $10nm, cap $20,000), for medium business in 2016 (turnover under $10mn, cap $20,000) and 2019 (under $50mn, cap $30,000), and for large business in 2020 ($500mn, cap $150,000) and 2021($5bn, uncapped).
In a 2025 analysis three Reserve Bank economists found: “ITBs seem to be somewhat less effective in Australia, compared to many other countries. This appears related to the existence of dividend imputation, which lessens the value of the ITB to company shareholders and means that the policies mainly affect small unincorporated businesses. This is an important insight … our results suggest the effectiveness of the policies studied is mixed at best, and probably highly dependent on the nature of the policy and macroeconomic conditions. In Australia, ITB policies as economic stimulus may be most effective during downturns which are driven by a shock to credit supply, rather than a sharp decrease in demand.”
Tax treatment of software in Australia depends on business size, how the software was acquired, and its cost. Businesses with turnover under $10mn can use the instant write-off for software costing less than $20,000, if more it has to be depreciated over its effective life of 5 years by 20% a year, which is what all other business do. Subscription fees and software with an effective life of one year or less can be deducted in the year of purchase.
The R&D tax incentive gives companies with turnover under $20mn a tax offset of up to 43.5% (their corporate tax rate is typically 25% plus a 18.5% premium), and for companies with turnover above $20nm their corporate tax rate plus a premium based on R&D intensity (R&D as a percentage of total expenses) of 8.5% up to 2% intensity , and 16.5% above 2% intensity. It is a complex and bureaucratic system that critics claim focuses on inputs and compliance rather than outputs. A 2016 review Ambitious Australia – Strategic Examination of R&D made 20 recommendations and suggested startups and ‘growth focused’ companies should be eligible for the R&D tax incentive, but innovation in low-growth and small companies could be supported through targeted grants or collaboration programs, instead of through the tax system.
ITBs are blunt instruments, but they should be targeted at high growth frontier firms with high productivity and high growth industries, the industries and firms most likely to utilise them best. This kind of preferential treatment is usually avoided in industry policy, because of the long-standing principle that picking winners should be avoided, however, ITBs benefit some firms and some industries more than others.
Industry policy has been evolving. In recent years the trend globally has seen increased use of subsidies and financial support, often channelled through government-owned intermediaries like development banks. The number of government interventions has greatly increased since 2020, as governments everywhere face supply-chain vulnerabilities, digital and energy transitions, and increased geopolitical rivalry. Industry policy has become more important and is used more often, and is increasingly focused on the competitiveness of firms, and through them industries and countries.
Conclusion
Investment in physical and intellectual assets is essential for building capacity and upgrading technology, and one reason for the low rate of productivity growth in Australia is the low level of investment in the capital stock, which is the accumulated amount of machinery and equipment (M&E), buildings, structures, software and research and development (R&D). With investment the capital stock is upgraded and grows, and a low level of investment means slower growth in output, increasing economic inefficiency, less economic dynamism, and lower productivity. The total capital stock includes M&E, Software and R&D, plus Non-dwelling construction, Weapons systems (in Government), Cultivated biological resources (in Agriculture), Mineral and petroleum exploration (in Mining), and Artistic originals.
Historically, there has been a strong relationship between the increase in the capital stock and productivity growth. This was the case for 30 years until the pandemic in 2020-22, but the relationship has broken down since 2023 as the total capital stock grew while labour productivity flatlined. This was also the story with the M&E capital stock, although it took a couple of years for productivity growth to increase after 2005, when the capital stock began increasing, and when the capital stock stopped rising in 2013 a couple of years later productivity growth flattened out. Since 2023 the M&E capital stock has grown strongly but productivity has not.
The software capital stock increased slowly until 2010, when the rate of increase began to grow. Over the last 10 years the software capital stock has grown rapidly, and much more than labour productivity, and a big increase in software capital stock since 2021 is not reflected in the productivity index. The trend in the R&D capital stock since 1996 followed a similar path to the M&E capital stock, but shows no relationship to the software capital stock, and there is a loose relationship between the R&D capital stock and labour productivity, at times growing less and sometimes faster.
The ABS provides data for 19 industries and their capital stock and capital expenditure. The top five industries accounted for 53% of the total M&E net capital stock, and there are 11 industries with 5% or less of total M&E net capital stock. M&E capex is also concentrated five industries, again with 53% of the total. Software capital expenditure and capital stock is also highly concentrated. The two industries Professional, scientific and technical services, and Finance and insurance services accounted for 34% of total software net capital stock in 2024-25, The top five industries had 57% of the capital stock and 56% of capex. There were 12 industries with 5% or less of the total software net capital stock.
Professional, scientific and technical services is the only industry that does a serious amount of R&D in Australia, with 34% of the capital stock and 37% of capex in 2024-25. Manufacturing with 18% of the capital stock and 16% of capex, and Finance and insurance services with 11% of the capital stock and 12% of capex make up the top three industries that do R&D.
With less investment the capital stock grows more slowly, leading to less or older capital per worker, slower growth in output, and therefore lower productivity. With a low rate of growth firms will not invest, or invest less, in expanding capacity and innovation. The result is less economic dynamism and increasing economic inefficiency, leading to lower growth in productivity and GDP. Consideration should be given to replacing asset depreciation and tax offsets with reducing the corporate tax rate, and increased use of subsidies and financial support rather than investment tax breaks, which when used should be targeted at high growth frontier firms with high productivity.
Increasing the level of capital expenditure should be a priority for both the Australian government and for industry, because in the short run the single most important factor in increasing the rate of productivity growth would be to increase investment, particularly in M&E. Although there are issues with public sector productivity, because this includes industries like health and education increasing productivity is slow and difficult. Therefore, industry has to take responsibility for matching capital investment with the training and improved processes needed to increase the growth rate of productivity. Government can be a facilitator of improved productivity through targeted policies and incentives, but it is not a substitute for industry.
The government should be aggressive in bringing autonomous vehicles companies from America and China to setup and scale in Australia. This is likely the biggest driver of productivity in the medium term.