
Firm Size and Construction Productivity
Employment, Value Added and Firm Size


There is a well-known relationship between firm size and productivity. Numerous studies across different industries have found large firms have significantly higher levels of output per employee. This post starts with international comparisons, first for the business sector then for construction and other industries. Australian data for construction firms and their revenue, employment and value added by size and per employees is presented. Explanations for the prevalence of small firms in construction is discussed.
International Comparisons
The 2025 OECD Compendium of Productivity Indicators said: ‘On average across countries, firms with more than 250 employees produce about twice as much output per hour as firms with 10-19 employees. Within each country, large firms also tend to be about 75% more productive than mid-sized firms (50-249 employees), and around one-third more productive than firms with 100-249 employees. These patterns point to substantial productivity differences by firm size, even within national economies.’ Figure 1 below is from the report, with the blue bars showing small firms and the black diamonds large firms in the business economy: ‘Labour productivity by enterprise size-class is measured as gross value added at current prices per person employed. Labour input is measured as total employment.’
Figure 1. Business economy, gross value added per person employed in US dollars
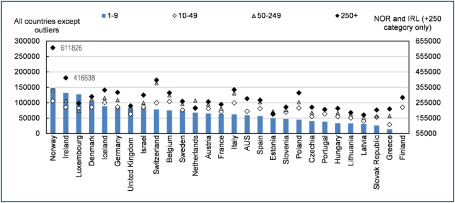
Source. Note: Finance, insurance, health and the public sector are not included in the OECD business economy.
As Figure 1 shows, in OECD countries the most productive firms are also the largest. The distribution of firm productivity is characterised by many below-average and a small number of high productivity firms, and those highly productive firms coexist with low productivity firms within industries. Countries with more small firms have lower productivity, and the difference in productivity across countries has been linked to this variation in firm performance.
Because the construction industry has so many small firms, this is particularly relevant. The structure of the industry is a pyramid made up of a wide base of many micro and small firms with a layer of medium sized firms in the middle, and a top containing a few large firms. This was the starting point in the Productivity Commission’s 2025 report Housing construction productivity: Can we fix it? which stated: ‘The construction sector is fragmented – made up of mainly small firms and individual subcontractors. This appears to, at least in part, stem from the way in which the sector is regulated. The large number of small firms potentially reduces capacity to innovate, including because the benefits from economies of scale and scope are forgone, limiting productivity gains in the sector.’
The report found in 2024 the average construction firm had 2.7 employees (not including sole traders or owner-managers), and residential construction averaged 1.5 employees in house construction and 1.9 in multi‑unit apartment and townhouse construction. It had Figure 2, showing Australia is not unique, in other countries the employment share of large firms is lower in construction than in manufacturing or services.
Figure 2. Construction compared
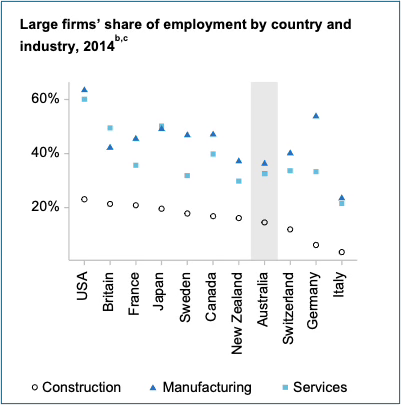
Source. Note: This data is 10 years old and comes from an OECD database.
https://data.jrc.ec.europa.eu/dataset/jrc-10113-rio_prod_lprod_by_firm_size
Australian Industry Data
The Australian Bureau of Statistics annual publication Australian Industry breaks industries into Micro firms with 0 - 4 employees, Small firms with 5 - 19 employees, Medium firms with 20 -199 employees, and Large firms with over 200 employees. The most recent was for 2023-24, the next issue for 2024-25 will be in May. The data used below is firms by size and shares of employment, wages and salaries, income, EBITDA and industry value added, followed by a discussion of value added per employee as a proxy measure of productivity.
Employment and Financial Indicators
Between June 2021 and 2024 total construction employment increased by 100,000 people, and in June 2024 there were 1,291,000 employed. However, as Figure 3 shows there has been no change in the number employed by Micro firms, which was 560,000 in 2025, and only 10,00 more employed by Small firms with 244,000 in 2023-24. Employment growth has been greatest in Medium firms, increasing from 247,000 in 2021 to 309,000 in 2025, while Large firms went from 155,000 to 178,000 employees.
Figure 3. Construction employment in June
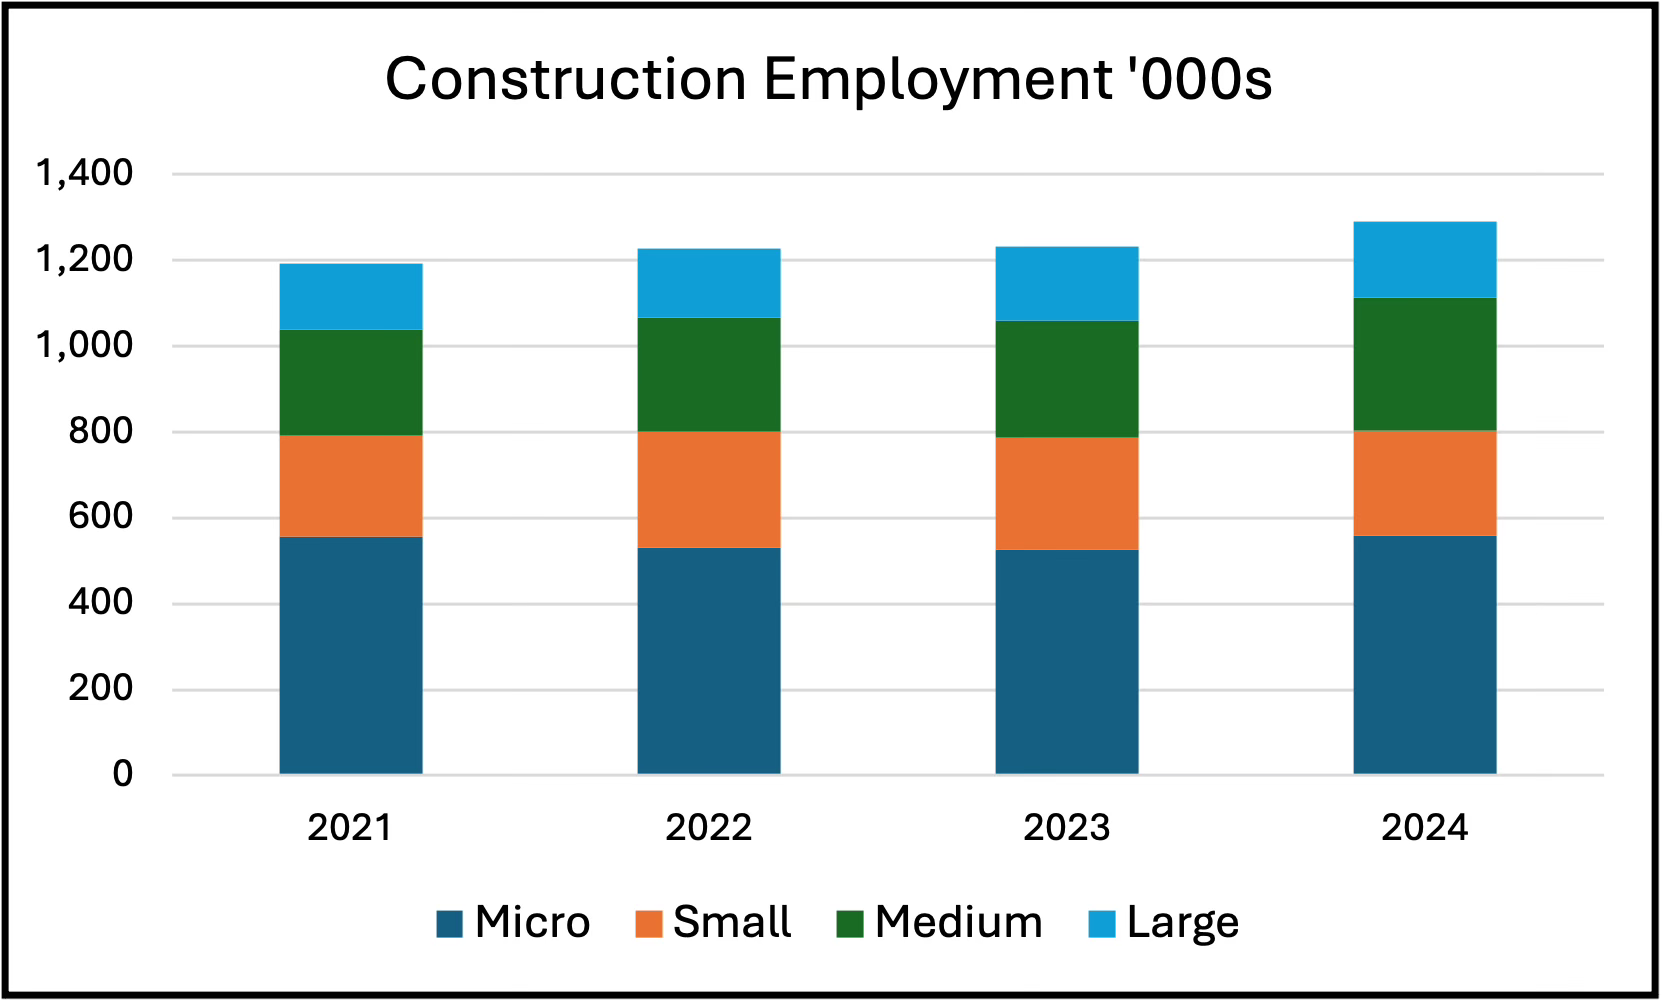
Source: ABS Australian Industry
Micro firms had 43 percent of construction employees in 2023-24. However, that share has fallen since 2020-21, when Micro firms were 47 percent of total employment. In 2024 the employment share of Small firms was 19 percent, of Medium firms 24 percent, and Large firms 14 percent. The trend in employment shares has varied. Small firms increased their employment share in 2021-22, but that has since fallen as the shares of Medium and Large firms increased .
Table 1. Percent share of construction employment
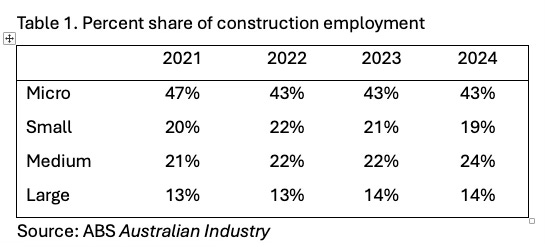
Source: ABS Australian Industry
As a share of total construction, despite having 43 percent of employment, Micro firms pay only 20 percent in wages and salaries. For small firms the shares are almost the same at 19 and 21 percent, but for Medium firms they are 24 and 33 percent, and for Large firms they are 14 and 26 percent.
Figure 4. Share of employment and wages and salaries, 2023-24
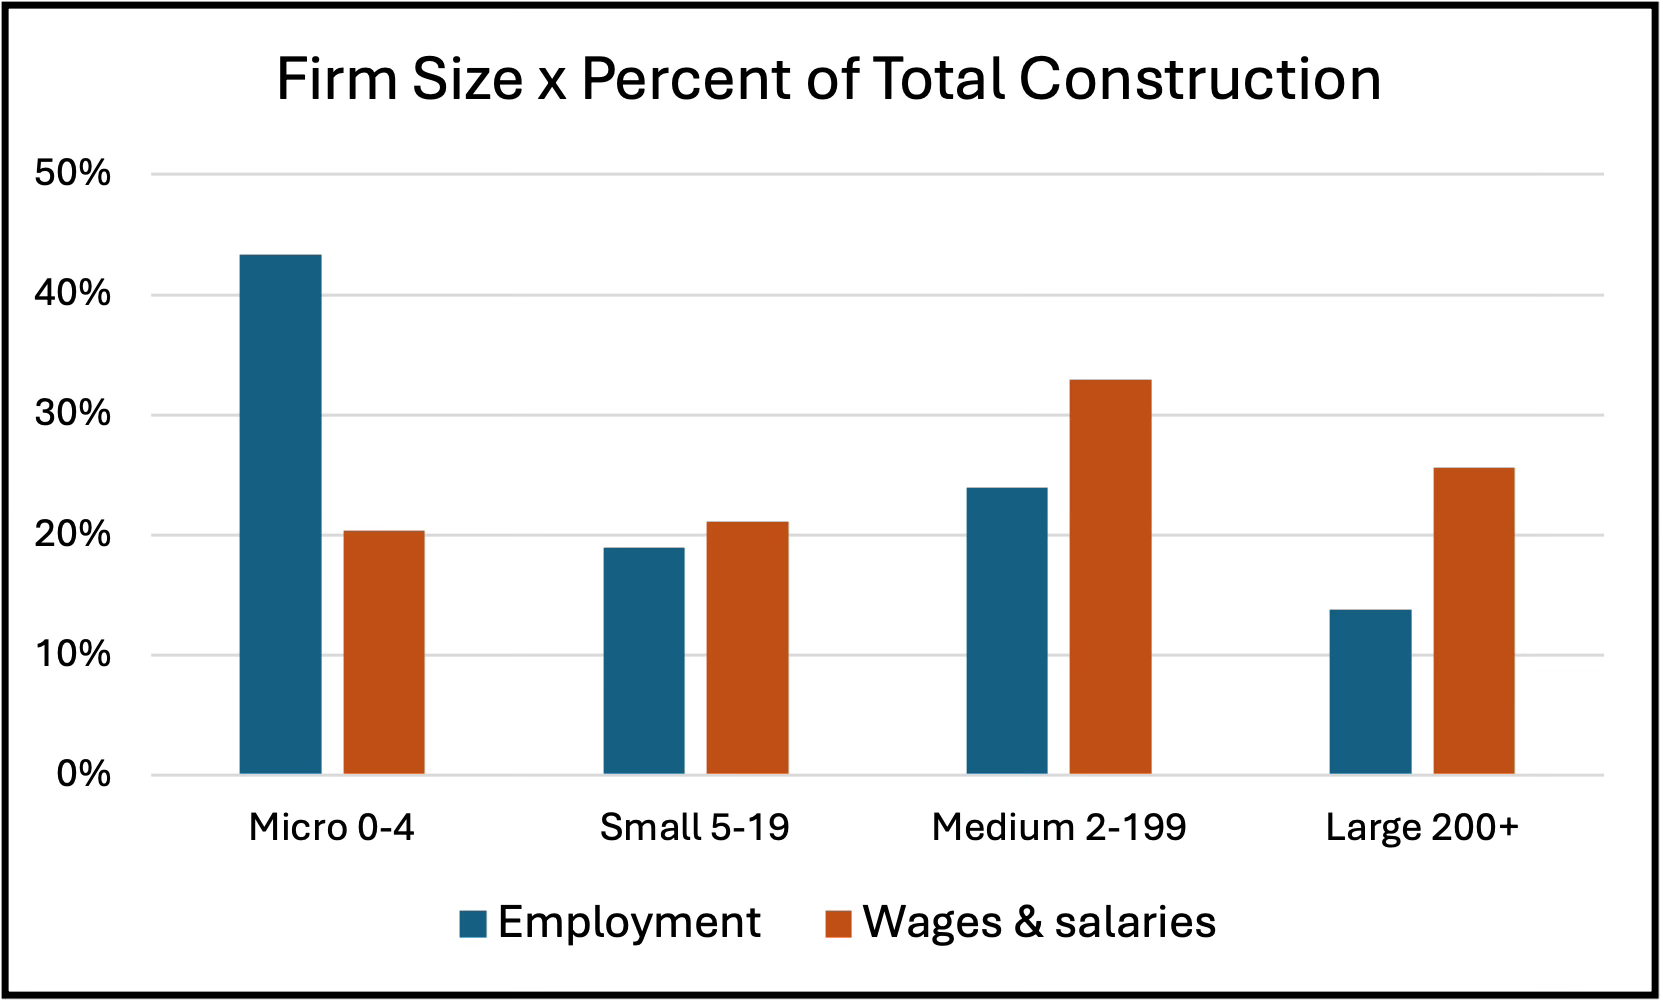
Source: ABS Australian Industry
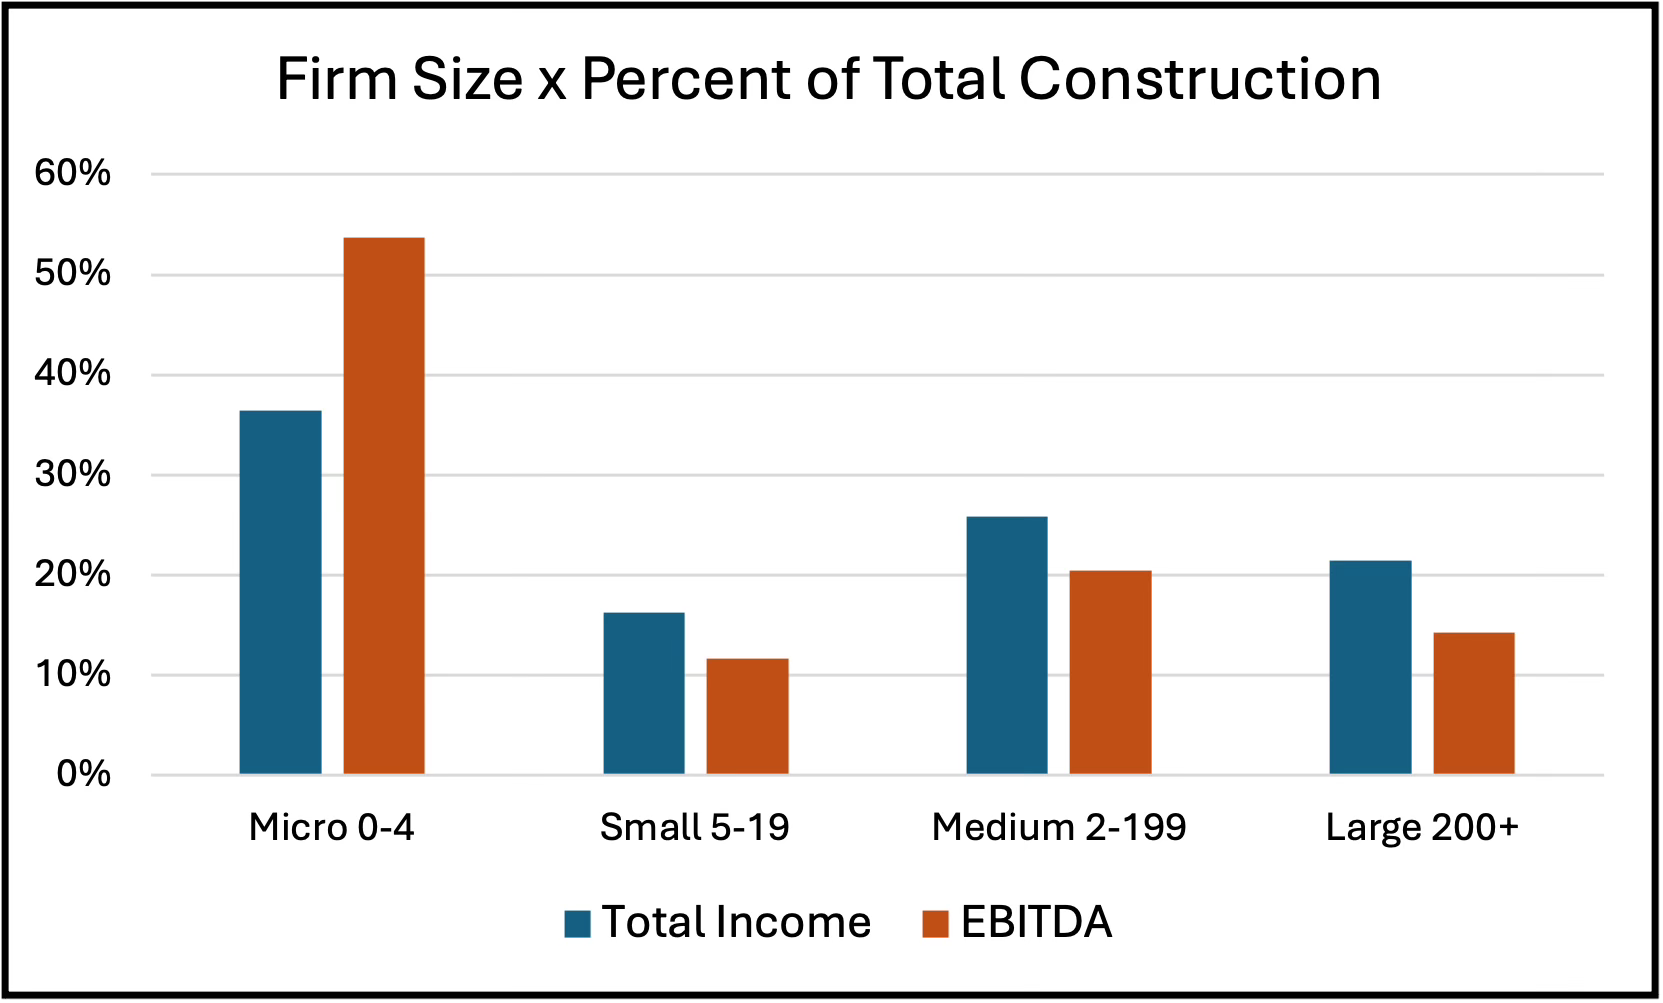
Those shares are reversed for income and earnings before interest, tax, depreciation and amortisation (EBITDA). Micro firms have 36 percent of total income but 54 percent of EBITDA, but the other size categories have smaller shares of income than EBITDA. For Small firms they are 16 and 12 percent, Medium firms have 26 and 20 percent, and Large firms 21 and 14 percent.
Figure 5. Share of income and EBITDA, 2023-24
Source: ABS Australian Industry
Comparing the amount per person employed highlights the differences between the firms. Table 2 has wages and salaries, income and EBITDA, and shows wages and salaries and income per employee increases with firm size, as would be expected, with a significant difference between Medium and Large firms. However, Micro firms have the highest EBITDA, at $61,000 per person, and this suggests Micro firms substitute company earnings for wages and salaries.
Table 2. Amount per person employed in 2023-24, $’000s
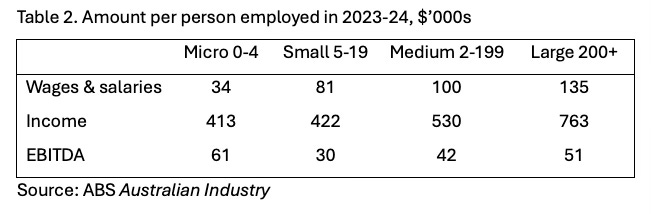
Source: ABS Australian Industry
Productivity Estimates
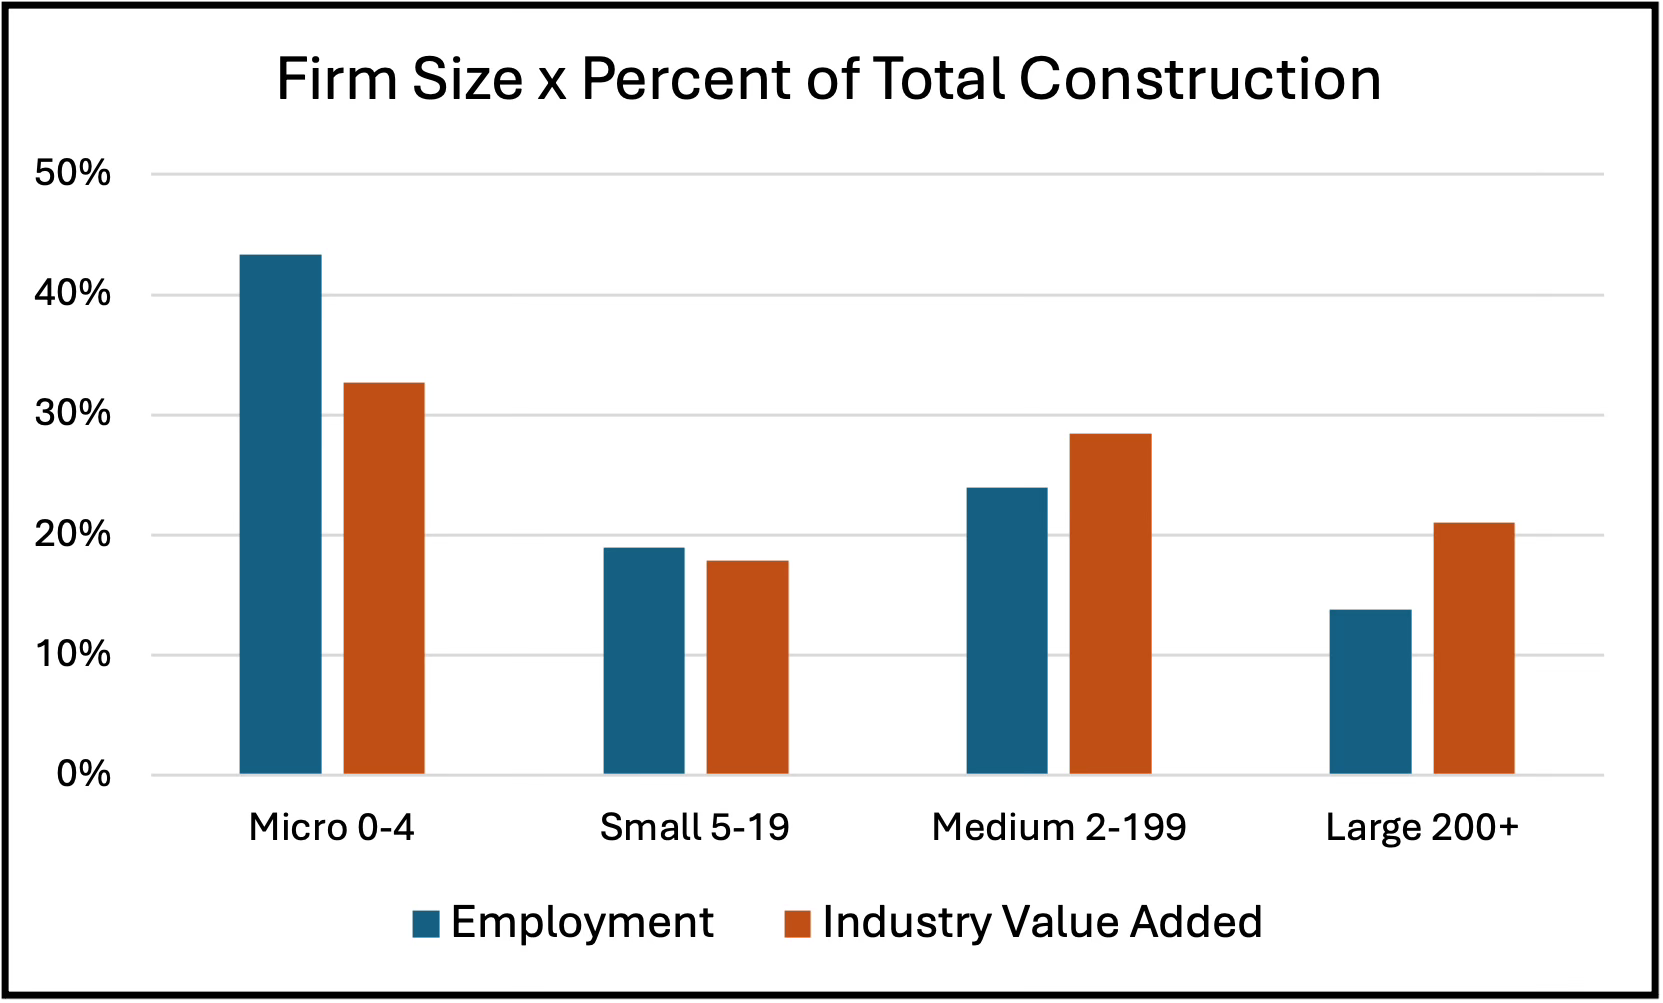
Australian Industry also has Industry value added (IVA) by firm size, and this shows an important structural characteristic of Australian construction. There is a big difference in the 33 percent share of total construction IVA for the Micro firms compared to their 43 percent share of total employment in 2023-24, and this much higher share of employment than IVA is indicative of a low level of productivity in Micro firms.
As Figure 6 shows, for Small firms the shares of total Construction are almost equal at 19 and 18 percent for employment and IVA respectively, and for Medium firms the shares are close at 24 and 28 percent. However, for Large firms there is a big difference, with a 14 percent share of employment compared to 21 percent of IVA. There is a much higher level of productivity in the few Large firms than all other construction firms.
Figure 6. Share of employment and Industry value added, 2023-24
Source: ABS Australian Industry
There have been trends in the share of IVA of the different sized firms since 2020-21, except for the 21 percent share for Large firms that has not changed. For Micro firms, in 2020-21 it was 30 percent of Construction, whereas in 2023-24 it was 33 percent. Medium firms also increased from 26 to 28 percent of Construction. The decline in IVA share has been in Small firms, from 23 to 18 percent.
IVA Per Person Employed
Industry value added (IVA) per person employed can be used as a proxy for labour productivity. When IVA per employee for the firm size categories is compared the differences are stark. In 2023-24 Micro firms had $104,000 IVA per person employed, Small firms $129,000, Medium firms $163,000, and Large firms $209,000. As percentages of large firm IVA per person, Micro firms have 50 percent, Small firms 60 percent, and Medium firms 75 percent.
The relationship between firm size and IVA per employee is not surprising, Large firms are typically better managed than Small firms, and management is the most important determinant of the capacity and capability of firms. How firms utilise their capabilities differentiates them within a diverse, location-based production system. It is a well-known characteristic of Small firms that they do not invest in innovation and have limited capex budgets, which means Small firms have a different trajectory of technological development to Large firms and are typically late adopters of new technology. Large firms have the management and financial resources required to invest in technological capability that Small firms do not.
Figure 7. Industry value added per person employed
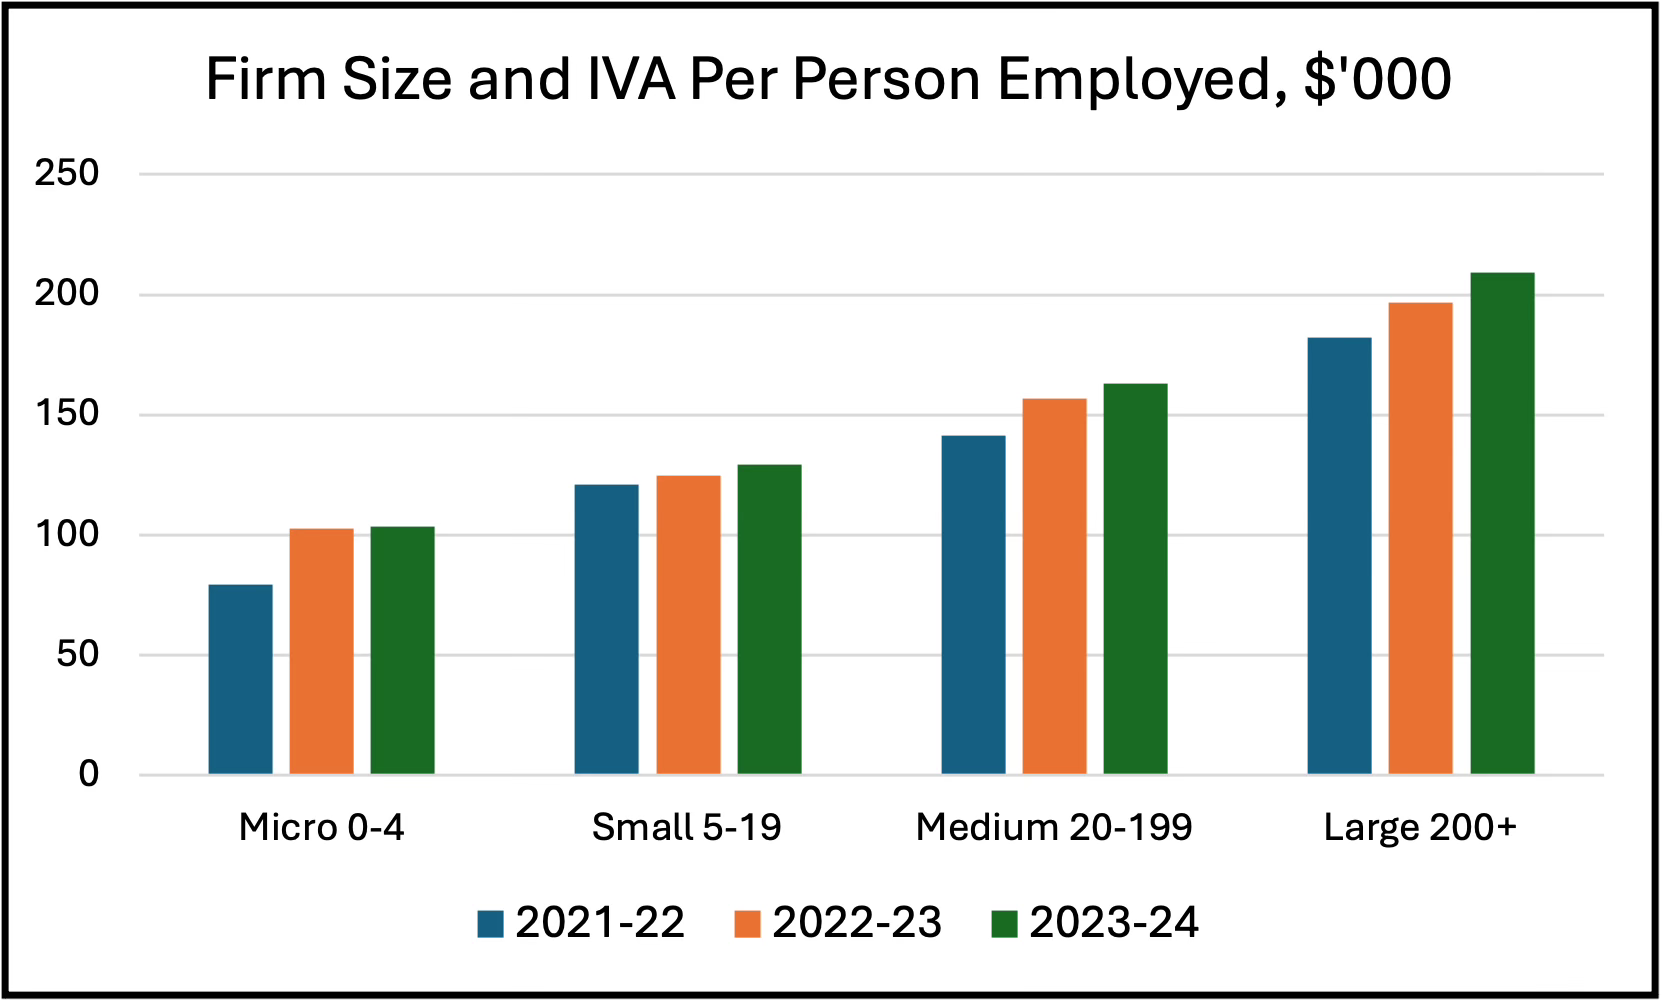
Note: In current dollars, not adjusted for inflation. Source: ABS Australian Industry.
Medium and Large firms have much higher levels of productivity, measured as IVA per employee, and the low level of productivity of the Micro and Small firms that are the great majority of construction firms affects the industry level. This suggests reducing the number of Micro and Small firms would raise construction productivity, However, many of these firms will be doing repair and maintenance work, which is typically much more time and labour intensive than new builds. Amalgamating Micro and Small firms into medium size ones that do the same work will not improve industry productivity if the nature of the work they do is the primary cause of the low level of productivity, not the size of the firms.
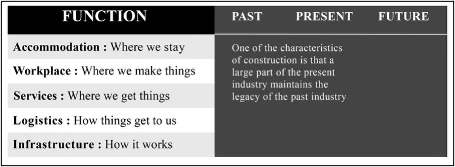
This points to one effect that does not get discussed in relation to construction productivity. Any productivity increases in new work from mechanisation and automation will tend to be cancelled out by an increase in the amount of labour intensive repair and maintenance (R&M) work required. Growth in the size of the stock of buildings and structures that new work creates in the present becomes R&M in the future.
Figure 8. Functions of the built environment
The ABS 2023-24 Construction Industry Survey found 9 percent of the income of Building construction and Construction services firms was in R&M, and another 19 percent was in alterations, additions, renovations and improvements. R&M was 8.3% of total Engineering income. Around three quarters of R&M is (unsurprisingly) done by trades in Construction services, and they also do most of the Residential alterations and additions.
IVA Per Person for Construction Subdivisions and Groups
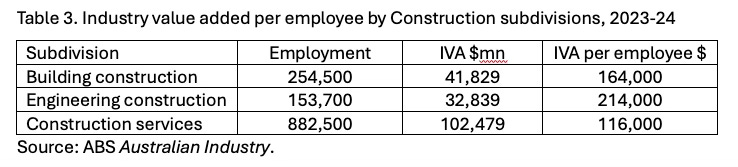
Another approach to looking at the productivity of small firms is to use subdivision and group data. Unfortunately, the ABS does not provide this data by firm size. However, as a general rule, because the trades are in Construction services, this subdivision and its five constituent industry groups will include many small firms. As Table 3 shows, IVA per employee for Construction services is lower than Building construction (that includes residential and non-residential building contractors) and around half that for Engineering construction (which includes heavy and civil engineering contractors).
Table 3. Industry value added per employee by Construction subdivisions, 2023-24
Source: ABS Australian Industry.
The ABS published detailed data in the Construction Industry Survey for 2023-24, released as part of Australian Industry, that included industry groups as well as subdivisions. Two of the three Construction subdivisions are divided into seven industry groups:
Subdivision 30 Building construction, divided into the two groups of Residential and Non-residential building;
Subdivision 31 Heavy and civil engineering construction; and
Subdivision 32 Construction services, with five groups of Land development and site preparation services, Building structure services, Building installation services, Building completion services, and Other construction services.
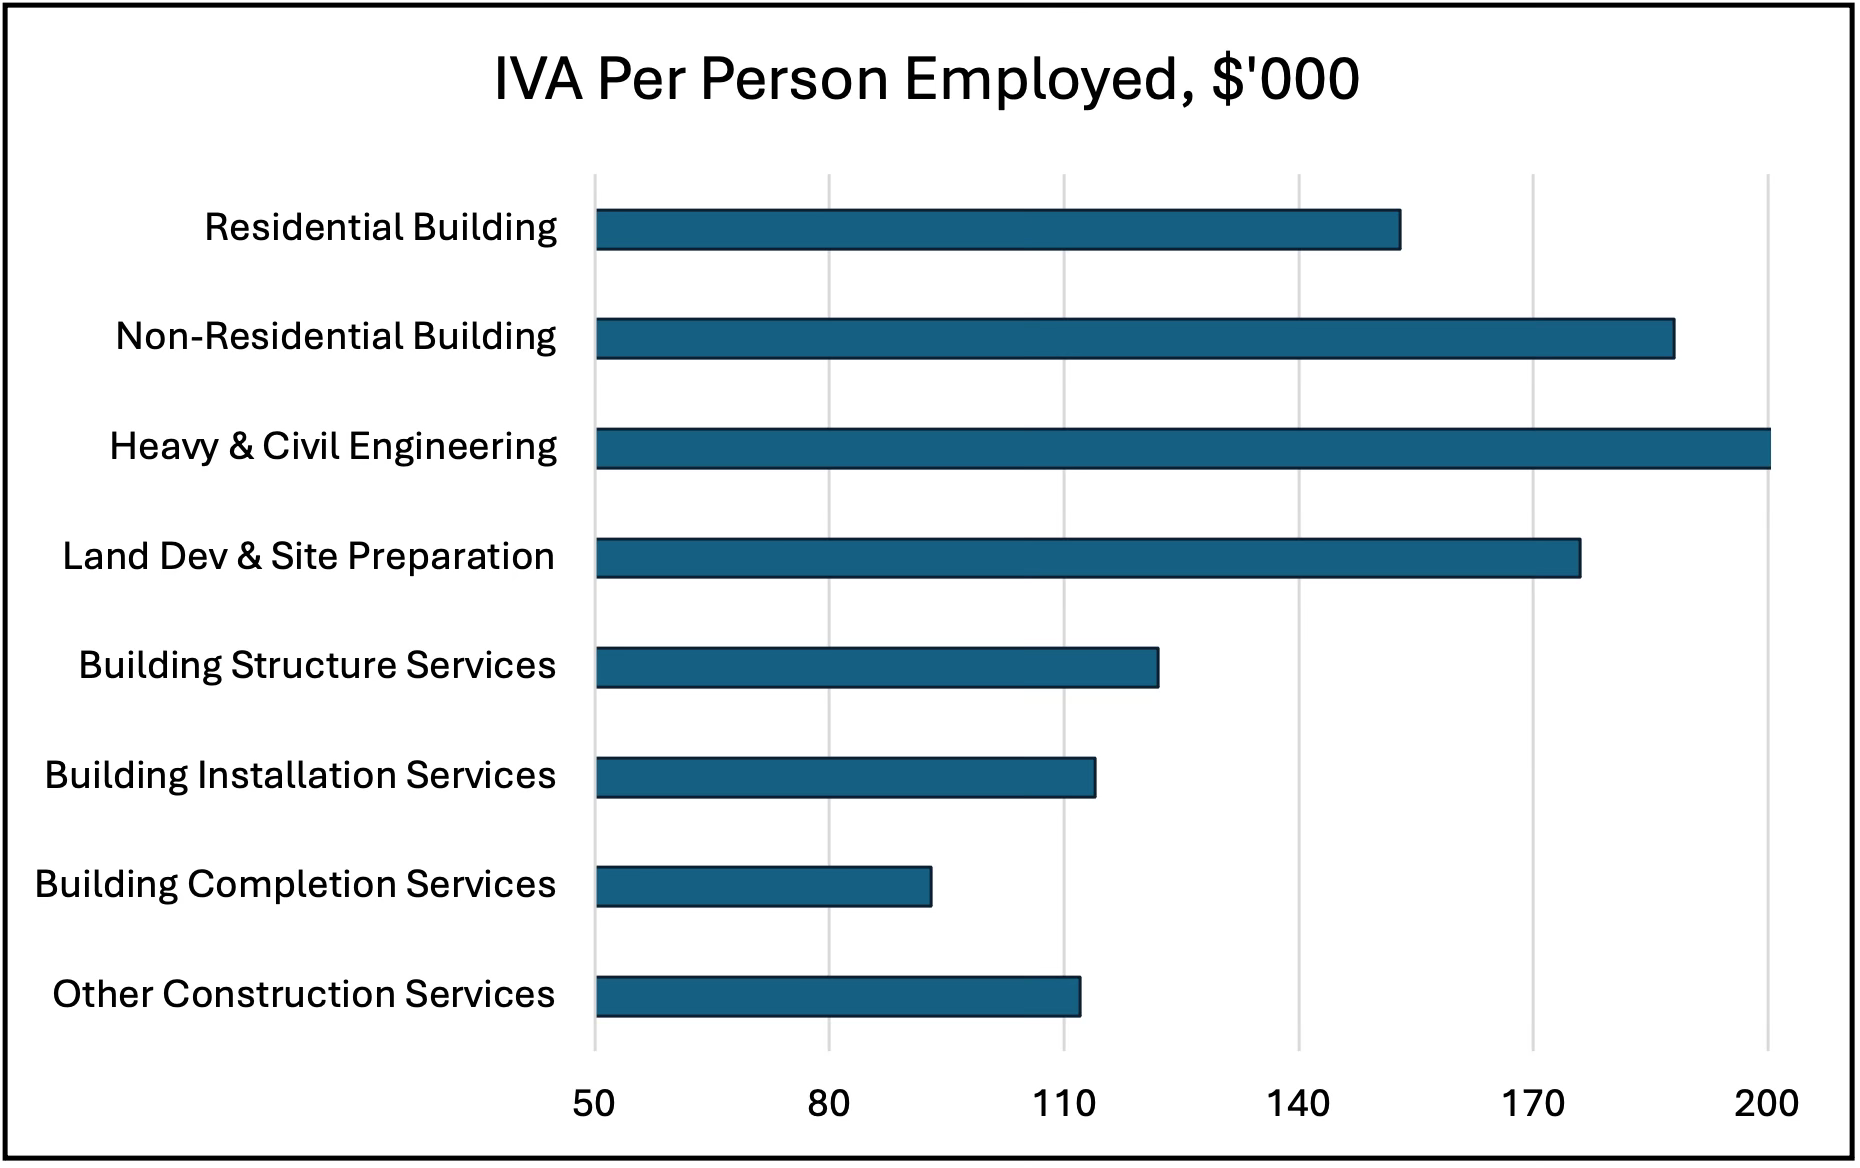
As Figure 9 shows, Engineering and Non-residential building had the highest IVA per employee. Land development and site preparation had the third highest IVA per employee, followed by Residential building. The four Construction services groups of Building structure services, Building installation services, Building completion services and Other construction services had IVA per employee values ranging from $93,000 to $122,000, or around half the level of Engineering.
Figure 9. Industry value added per employee for industry groups, 2023-24
Source: ABS 8155DO008.
Table 4. Industry value added per employee, 2023-24
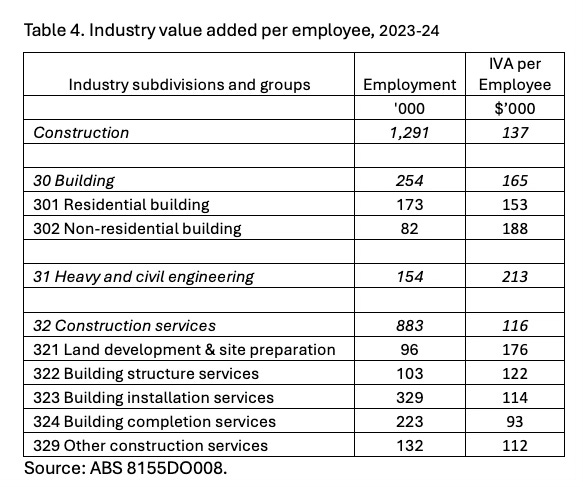
Source: ABS 8155DO008.
Why So Many Small Firms in Construction?
The 2025 report from the Productivity Commission (PC) Housing construction productivity: Can we fix it? recommended improving construction productivity by reducing the regulatory burden, streamlining and speeding up approval processes, supporting innovation, and improving workforce flexibility. Construction businesses stay small because:
Regulations differ across geographic areas, and make it hard to efficiently replicate a development or construction process across the country
Building regulation tends to be project‑based rather than firm‑based, with regulatory approval and compliance needed for each new project. ‘If a builder does scale up, their regulatory costs scale up proportionally, reducing or even negating the benefits of expansion.’
Project risk management leads to highly disaggregated specialisation and outsourcing (i.e. subcontracting) of skilled, semi‑skilled and unskilled work.
These explanations are obviously underwhelming. Regional differences in regulations could and should be reduced, but many reflect differences in climate and building safety (e.g. cyclones in Queensland versus bushfire in Victoria). Regulatory costs are business expenses, and are recovered from clients. As the data above shows, industry fragmentation is clearly an issue, although the actual degree of subcontracting varies considerably between sectors and between firms within the sectors.
The PC cited US research that showed that increasingly strict land-use regulation has resulted in more small firms doing more small projects [2]. However, construction is a local business, and building detached houses is done in local markets for local clients, and that favours small firms that are close to both their customers and regulators. Small firms will work within their local area. Typically, larger firms operate as a series of semi-independent project offices, because there is a physical limit to managing projects based on the time and cost constraints of distance. Regulation might enhance the effect of location through local planning laws, but does not create the diseconomies of distance.
CEDA Size Matters Report and Tax Reform
The Committee for Economic Development of Australia (CEDA) 2025 report Size Matters: Why construction productivity is so weak argued the dominance of very small businesses, Australia’s tax settings and complex land regulation affect productivity in construction. The particularly useful contribution in this report was their analysis of tax settings, showing how being self-employed can result in paying less tax than a salaried employee earning the same income, despite being taxed at the same marginal rates. Self-employed businesses typically operate as a private company or sole trader and assess their own tax obligations, and are more likely to report their income just under thresholds where marginal tax rates increase. Their analysis found:
‘around 8.5 per cent of independent contractors in the construction sector disclose income under the tax-free threshold of $18,200, and therefore pay no tax, compared with just 2 per cent of salaried construction workers. 2.2 per cent of the contractors disclose no income at all, compared with 0.44 per cent of salaried workers.
These results are not unexpected given the structure of our taxation system. Employees or salaried workers typically make ongoing personal income tax contributions deducted from each salary payment with rising thresholds based on income. In contrast, private companies are taxed at a flat rate of 25 per cent for small and medium businesses (with revenue of less than $50 million) and 30 per cent for larger businesses.
A high-income construction worker earning $148,000 per year would pay 26 per cent tax as a salaried worker. As a contractor, they could structure their income with a discretionary trust and a ‘bucket’ company and pay just 18 per cent tax – a difference of $12,400 in annual-take home pay after tax. Additionally, in trust structures, a high-income individual can distribute income across household members, who may pay even lower tax rates. Or, in rare cases, contractors can simply misrepresent their income and avoid tax altogether.’
CEDA concludes there are significant incentives for construction workers to be self-employed as a private company to minimise their tax bill. Another tax setting that favours small firms allows businesses with turnover under $10 million to claim an immediate tax deduction on vehicles and other business assets like tools and equipment. Another factor is payroll tax thresholds that vary between the states, and small firms will adjust their reporting and hiring to remain under the threshold for the tax. CEDA also found around 60,000 construction companies pay the lower federal company tax rate of 25 per cent rate for small and medium businesses rather than the large business rate of 30 per cent.
CEDA also argues the number of small firms is the result of the ‘cyclical and segmented nature of the industry’ and the shift to subcontracting. ‘While subcontracting may be the right approach for a given business or project, at an economy-wide level it means more work is done by smaller, less productive firms. And as subcontracting fragments the industry, this has likely increased the time and effort spent on procurement, contract negotiations, supervision and regulation, and dispute resolution.’
Conclusion
For construction, issues like employment, income and productivity cannot be sensibly discussed without reference to the number and size of firms in the industry. The annual Australian Bureau of Statistics publication Australian Industryprovides data by firm size in four categories: micro firms with up to 4 employees; small firms 5-19; medium firms 20-199; and large firms with more than 200 employees. The data includes employment, wages and salaries, income, earnings before interest, tax, depreciation and amortisation (EBITDA), and industry value added (IVA).
In 2023-24, Micro firms had 43 percent of total construction employment but pay only 20 percent in wages and salaries, Small firms had 19 percent of employment and 21 percent of wages and salaries, Medium firms 24 percent and 33 percent, and Large firms 14 percent of employment and 26 percent of wages and salaries. The shares of the firm size categories are reversed for income and EBITDA.
Micro firms have 36 percent of total income and 54 percent of EBITDA, but for Small firms they are 16 and 12 percent, Medium firms 26 and 20 percent, and Large firms 21 and 14 percent. Comparing the amount per person employed highlights the differences between the firms. Wages and salaries and income per employee increase with firm size. However, Micro firms have the highest EBITDA per employee, which suggests Micro firms substitute company earnings for wages and salaries.
IVA is roughly output minus the cost of inputs, including labour. In Australia, large firms employed 14 percent of the workforce and produce 21 percent of total construction IVA. Micro firms had a 33 percent share of IVA compared to their 43 percent share of total employment in 2023-24. For Small firms the shares of total Construction are almost equal at 19 and 18 percent for employment and IVA, and for Medium firms the shares are close at 24 and 28 percent.
An imperfect but useful proxy for productivity is IVA per employee. Comparing IVA per employee shows the extent of the productivity gap between large and small firms. Micro firms had $104,000 IVA per person employed, Small firms $129,000, Medium firms $163,000, and Large firms $209,000. As percentages of Large firm IVA per person, Micro firms have 50 percent, Small firms 60 percent, and Medium firms 75 percent. There is a much higher level of productivity in the relatively few Large firms than all other construction firms. Unfortunately the ABS does not provide the number of firms in each size category.
Australian Industry also provides data for the three industry subdivisions of Building, Engineering and Construction services, and the industry groups within them. Unsurprisingly, IVA per employee was highest in the capital intensive Engineering subdivision at $214,000. It was $164,000 for Building, and $116,000 in Construction services.
The three industry subdivisions are further divided into seven industry groups. In 2023-24, Engineering with $213,000 and Non-residential building with $188,000 were the groups with the highest IVA per employee. Land development and site preparation with $176,000 had the third highest IVA per employee, followed by Residential building with $153,000. The Construction services groups of Building structure services, Building installation services, Building completion services and Other construction services had IVA per employee values ranging from $93,000 to $122,000, or around half the level of Engineering. Because the trades are in Construction services, this subdivision and its industry groups include many of the Micro and Small firms.
Many of the Construction services, Micro and Small firms are engaged in labour intensive work doing residential alterations and additions, refurbishments, and repair and maintenance. There are few productivity gains available in this type of work. Because industry statistics include the 9 percent of work done as R&M with new work, the overall level of industry productivity is lowered [3]. Amalgamating Micro and Small firms into medium size ones that do the same work will not improve industry productivity if the nature of the work they do is the primary cause of their low level of productivity, not the size of the firms.
Two explanations for the prevalence of Micro and Small firms in construction are regulation and the tax system. The Productivity Commission argued excessive regulation was leading to more small firms and recommended improving construction productivity by reducing the regulatory burden. A Committee for Economic Development of Australia report found tax incentives favour independent contractors in construction, who are four times more likely to disclose income under the tax-free threshold than salaried workers. Other tax settings, such as the instant asset write-off and payroll tax thresholds, also favour smaller construction firms. However, while both of these factors affect the industry, the structure of the construction industry is determined primarily by the nature of the work, the majority of which has many small firms working on small projects in their local area.
That construction needs to improve productivity is something all industry stakeholders can agree upon. Despite all the time, effort, and words expended on this, over many decades there has been no increase in industry-wide productivity. There is good evidence that large firms have significantly higher productivity than small ones, but the great majority of firms are small. Building detached houses is often a local business done by small firms, and many of the Micro and Small firms in Construction services are doing labour intensive repair and maintenance work. These structural characteristics of the industry have and will continue to limit growth in construction productivity.
[1] In Australian Industry the total number of people employed has no breakdown of full-time and part-time employment, so the totals are close but not the same as in the ABS Labour Force Australia, Detailed.
[2] Why Has Construction Productivity Stagnated? The Role of Land-Use Regulation,
D’Amico, L., Glaeser, E., Gyourko, J., Kerr, W., and Ponzetto, G. 2024.
[3] This highlights the need for better data on construction work done and employment. If employment was allocated to the type of work done (i.e. to repair and maintenance, alterations and additions, residential and non-residential building, and engineering construction), this would provide more relevant measures of productivity, allowing the labour input to each type of work to be estimated and matched to the value of work done.