Comparisons of Construction to Manufacturing Use Flawed Data
Construction productivity has been negatively compared with manufacturing (e.g. McKinsey), and the comparisons are typically between all of construction and all of manufacturing. The problem is that both are averages of extremely varied economic activities of firms, based on data collected by the standard industrial classification (SIC) system. This makes useful comparisons between the two difficult, as this post using UK data argues. The post first breaks down industry statistics on UK construction and manufacturing to show the structural differences, and then compares construction to the car industry, showing a comparison between the two requires including repair and maintenance with vehicle manufacture. Lessons from other industries and their production methods and processes can be useful and informative, however, comparing performance between industries is very difficult without adjustments to make the subjects comparable.
The production of building elements and components somewhere other than the construction site has been variously called prefabrication, pre-cast and pre-assembly construction, and offsite manufacturing (OSM). The degree of OSM and preassembly varies from basic sub-assemblies to entire modules, and the use of OSM varies greatly from country to country. Types of offsite construction are panelised systems, volumetric systems with partial assembly of rooms, units or pods offsite, and factory built modular components or homes. Offsite manufacture is used to describe factory production and preassembly of components, elements or modules. Prefabrication is used to describe offsite production of components that are installed onsite. The idea that OSM and prefabrication are the solution to problems of poor quality and low productivity in construction became central to the movement to ‘reform’ construction by making it more like manufacturing.
Advocates of industrialized building argued for construction to adopt similar production practices to manufacturing, particularly car manufacturing. However, while there are some factory made buildings, the number and type of standardized buildings is limited, whereas opportunities for producers of standardized construction products are widespread. Onsite production is organized around those standard parts and materials but manufacturing, in contrast, is organized around standardised products and continuous production runs.
In UK construction the largest grouping by number of enterprises and employment is specialised construction, typically single trade contractors (there are 17 individual industries or trades under SIC 43). The largest group by turnover is building contractors, including residential and non-residential building with only two SIC sub-categories. Civil engineering contractors have the smallest number of enterprises and employment but the highest average number of employees and highest average turnover per enterprise. Civil engineering work is typically of larger scale compared to building work.
Table 1. UK Construction turnover 2019
Source: Meikle, J. and de Valence, G. 2022. Construction products and producers: One industry or three, in Best, R. and Meikle, J. (eds.) Describing Construction: Industries, projects and firms, London: Taylor and Francis. Data from ONS Annual Business Survey 2018.
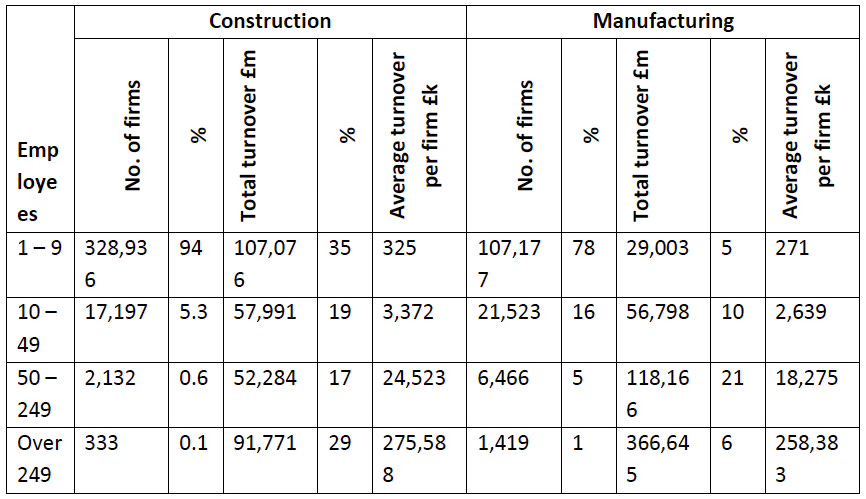
Data on construction turnover by size of firm includes the value of subcontracting and construction work by non-contractors. The distribution of construction turnover by number and size of firm and average turnover per firm is: 99% of construction firms have less than 50 employees and are responsible for just over 50% of turnover; and 94% of firms have less than 10 employees and are responsible for around 35% of turnover. At the other end of the size scale, less than 1% of firms, those with 50 or more employees, are responsible for the other 50% of turnover. Around 0.1%, a few hundred, are responsible for around 30% of turnover and each of these has an annual turnover averaging around £275 million. The structure of the construction typically takes this form.
Table 2. Construction firms by employment 2019
Source: Meikle, J. and de Valence, G. 2022. Construction products and producers: One industry or three, in Best, R. and Meikle, J. (eds.) Describing Construction: Industries, projects and firms, London: Taylor and Francis. Data from ONS Annual Business Survey 2018.
Although the SIC groups all construction firms into a single category, that is for statistical convenience based on conventions developed originally for classifying manufacturing. The exclusion of design from construction output while included in manufacturing and the inclusion of R&M in construction but not in manufacturing is one result.[i] Another is the view of construction as a single industry, producing and maintaining buildings and structures, despite their many different types and the differences in the producers and processes used in their delivery.
Manufacturing in the UK comprises 24 two-digit industrial groups (SIC 10 to SIC 33), for example, food products (SIC 10), manufacture of paper and paper products (SIC 17) and manufacture of motor vehicles, trailers and semi-trailers (SIC 29); and 325 individual industries. Manufacturing of fabricated metal products except machinery and equipment (SIC 25) is the largest two-digit group with 22 individual industries, 26,301 total group enterprises and total group turnover of £23.6 billion; the smallest is the single industry group of manufacture of tobacco products (SIC 12) with nine enterprises and a turnover of £12 million. Manufacturing is not only relatively large but extremely diverse and industry policies have reflected that by targeting specific industries such as IT and automobiles for example.
The table below shows that total UK Construction turnover is less than 50% of Manufacturing turnover, although it is much larger than any individual manufacturing industry. Manufacturing has 21% of firms that are small and medium size, construction has 6%, and manufacturing turnover is more concentrated in the larger firms.
Table 3. UK construction and manufacturing compared by size of firm
Source: Meikle, J. and de Valence, G. 2022. Construction products and producers: One industry or three, in Best, R. and Meikle, J. (eds.) Describing Construction: Industries, projects and firms, London: Taylor and Francis. Data from ONS Annual Business Survey 2018.
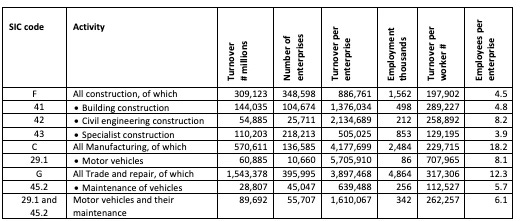
The largest UK manufacturing industry in 2018 was motor vehicles, with 22% of construction turnover and 5.5% of construction employment, and it is manufacture of motor vehicles that is often compared with construction and used as the example to be followed in OSM. Based on turnover per employee (an imperfect but indicative measure of productivity), vehicle manufacturing (&07,965) is over three times as productive as construction (197,902). This might be the case, or it may be a statistical illusion, created by the framework of the SIC.
Table 4. Comparing UK construction and vehicle manufacture 2018
Source: Meikle, J. and de Valence, G. 2022. Construction products and producers: One industry or three, in Best, R. and Meikle, J. (eds.) Describing Construction: Industries, projects and firms, London: Taylor and Francis. Data from ONS Annual Business Survey 2018.
Table 5 breaks down construction to its main components and adjusts manufacturing by including both the manufacture and repair and the maintenance of motor vehicles. All construction includes both new construction and the repair and maintenance of existing buildings and works. The manufacture of motor vehicles does not. In order to adjust for this, maintenance of vehicles (SIC 45.2) should be added to manufacture of vehicles (SIC 29.1) to make the groups more comparable. When vehicle maintenance is added to manufacture, turnover increases by 58% but employment increases by almost 180%.
This allows a more realistic comparison and reveals that motor vehicles and their maintenance (SIC 29.1 plus SIC 45.2) has almost the same turnover per worker (1.6mn) as building construction (1.4mn), twice that of specialist construction (0.9mn) but less than engineering construction (2.1mn). Turnover per worker is a metric of productivity and, on this basis, all construction is less productive than all manufacturing and much less productive than motor vehicle production. However, when repair is added to manufacture, the car industry is on a par with building, the largest part of construction.
Table 5. Turnover and employment by SIC division 2018
Source: Meikle, J. and de Valence, G. 2022. Construction products and producers: One industry or three, in Best, R. and Meikle, J. (eds.) Describing Construction: Industries, projects and firms, London: Taylor and Francis. Data from ONS Annual Business Survey 2018.
With the differences in these industries in terms of firm size, turnover and employment, it is difficult to draw clear conclusions from a comparison of their structure, economic performance or productivity. Vehicle manufacture and, to a lesser extent vehicle repair and maintenance, are capital intensive businesses. Construction, generally, is not, although a few activities like tunnelling and prefabricated housing are. Comparisons between manufacturing and construction based on the figures from the SIC are not helpful or accurate without adjustment.
Nevertheless, on the basis of these comparisons, for the last three decades advocates for applying production methods from car manufacturing to offsite manufacturing in construction have argued this is necessary to improve construction productivity and products. Despite the distinctly different characteristics of manufacturing and construction there have been and are many attempts to industrialize construction. However, after decades of efforts to promote OSM, the market share of OSM remains small, estimates are low single digits of total construction work in the UK, US and Australia. Success elsewhere is restricted to specific markets such as fast food outlets and hotels, or house manufacturers like the Japanese and Scandinavian firms Sekisui and Ikea.
The US and UK governments have both supported OSM, with the UK government funding research, publishing case studies and promoting OSM in construction for decades.[i] In the US a Technology Roadmap for Advanced panelised construction was produced in 2003 for the Department of Housing and Urban Development as a Partnership for Advanced Technology in Housing (PATH[ii]). Despite these efforts, offsite production is not industry practice in either country. Although pre-cast concrete and panelised construction are widely used, OSM has not led to significant advances in mechanization or required a thorough reorganization of project management methods.
OSM markets exist mainly in housing and institutional building, wherever it is the most effective or efficient piece of technology available and there is a lot of repetition from project to project. This manufacturing-centric view of progress in construction, endorsed by numerous government and industry reports, was the end point of the development trajectory from the first to the third industrial revolutions. Despite all efforts this has not become the primary system of construction of the built environment because OSM does not deliver a decisive advantage over onsite production for the great majority of projects. Instead, construction has a deep, diverse and specialised value chain that resists integration because it is flexible and adapted to economic variability.
[i] Farmer, M. 2016. Modernise or die, London: Construction Leadership Council.
[ii] PATH, 2004. Technology Roadmap: Advanced panelised construction, 2003 Progress Report. Partnership for Advanced Technology in Housing (PATH), Department of Housing and Urban Development, Office of Policy Development and Research, Washington, D.C.
[i] Despite the importance of repair and maintenance, only Canada has an annual business capital and repair expenditures survey. Between 2006 and 2016 construction R&M by firms averaged nine percent of their total capital expenditure, or around 1.2 percent of GDP, ranging between one percent of GDP in 2006 and 1.3 percent in 2012. Statistics Canada. Table: 34-10-0035-01 Capital and repair expenditures, non-residential tangible assets


